11.1 Building and Configuring a Monitoring Group

Novell Remote Manager lets you build and configure groups of items for monitoring Linux server or NetWare server health, as well as providing various statistics for servers running other operating systems. A few of the preconfigured monitoring item types are NRM Health Status for a single server or a group of servers, Ping to a specific port, IP connectivity, and status of connectivity to a Web page.

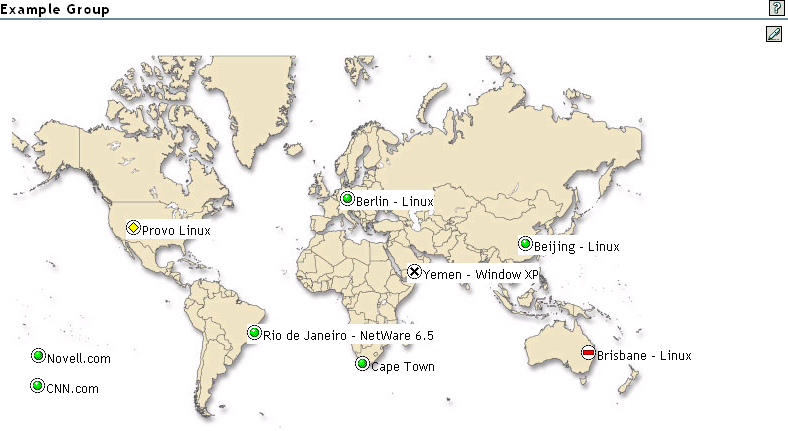
Monitoring items can be defined and represented by icons on a page as shown in the following figure. The icons can represent a single item or a group of items.

Figure 11-2 Example Novell Remote Manager Server Health Group with Connectivity to a Web Page and Ping Items.

To build and configure a new monitor group:

  1. Click the Configure New Group link in the navigation frame.

  2. Right-click the Group Monitoring Operations page.

    HINT:If your browser does not support right-click functionality, try double-clicking the Pen icon Reports icon that supports functionality performing group operation tasks. in the upper-right corner of the page.

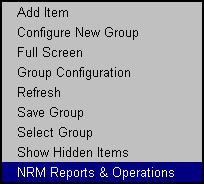
    You should see a menu that looks like the following:

    Example Group right-click menu
  3. Click Add Item, and do the following:

    1. Complete the Monitoring Item Configuration form.

      Example Add New Monitor Item page

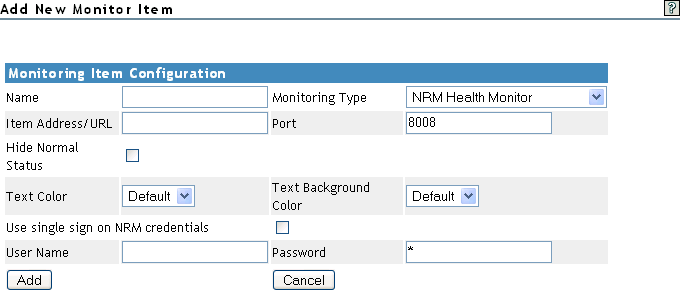
      For each item you add to a group or want to change from the default setting (health monitor), complete the following options on the Monitoring Item Configuration form.

      Option

      Details

      Name

      Provide a descriptive name for the item.

      Monitoring Type

      Specify one of the following types:

      • Label: Text information to use as a label on the group monitor display. Lets you identify each group specifically as needed.

      • NRM Health Monitor: Shows the health status of each server in the group. Lets you access the specific health page for each server in the group.

      • ICMP Echo (Ping): Shows the response when sending ping requests to the specified DNS name or IP address.

      • TCP/IP Service Query: Shows response activity of a designated TCP/IP service. This query attempts to make a TCP connection to the specified address and port. Returns green (good) health if any services are listening. For example, you could set up a health monitoring item to tell you whether your GroupWise server is still listening for logins from clients. The only states that are returned are green (good), which means the connection was successful, and red (bad), which means the connection was not successful.

      • Download Web Page: Shows the response when trying to download a Web page from the specified URL. You need to type the second part of the address only.

      Item Address/URL

      Specify the IP address for the server that you want to monitor or ping, or specify the URL for the Web page that you want to download.

      The address can be an IP address or DNS name.

      You do not need to specify the HTTP:// portion of a URL.

      Hide Normal Status

      When selected, only items that are in an abnormal state are displayed.

      If you want to monitor all statuses, leave the check box deselected.

      Text Color

      Black is the default. You can select any other color from the drop-down list.

      The default is provided. You can type a different port to use.

      Use Single Sign on NRM Credentials

      When selected (default), the credentials used to access this item's data are the same as the credentials that the user logged into Novell Remote Manager with.

      When deselected, enter the credential necessary to access the item in the User Name and Password fields.

      Text Background Color

      Clear is the default. You can select any other color in the drop-down list.

      You can also define your own monitoring types or edit the default defined health types by editing the XML data in the sys:\login\nrmgrouphealthinfo file. For more information, see Defining or Editing Group Monitoring Types.

    2. Click Add.

    3. Drag the newly created monitor items to the desired location.

    4. Repeat Step 3.b and Step 3.c for each item that you add.

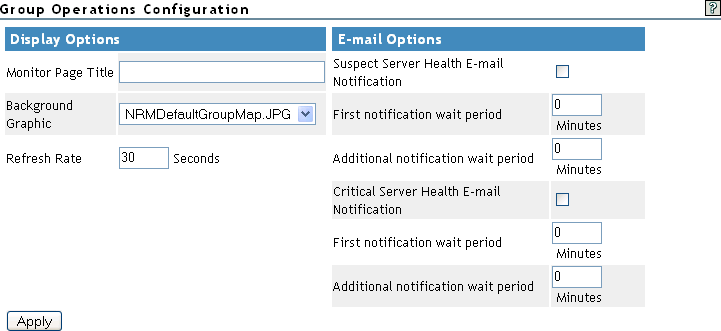
  4. (Optional) If you want to change any of the following, change the configuration of the group:

    • The label for the group

    • The graphic displayed

    • The refresh rate

    • The suspect and critical e-mail notification for the group

    1. Right-click the customized Group page, then click Group Configuration.

    2. Complete the fields as desired on the Group Operations Configuration page.

      Example Group Operations Configuration form

      Option

      Description

      Display

      The display options let you control the following:

      • Monitor Page Title: Specify a title to be shown at the top of the monitor page in the header area when the page is built.

      • Refresh Rate: Specify the number of seconds between status queries to the server.

      • Background Graphic: Select a graphic from the drop-down list for the monitor items to be displayed on. This option can be helpful if you want to show specific locations of the item being monitored.

        If you want to add a customized graphic, add it to the sys:\login\nrmgroupmaps directory.

      E-mail

      The e-mail notification options control how and when e-mail notifications are sent when the server health changes. E-mail notifications are sent to the addresses in the mail notification list using the mail servers set on the Mail Notification Configuration page.

    3. Click Apply.

  5. Perform the desired task, or save the group and perform the task later.

    In this release, the only task you can perform on Linux servers is to compare the server up times.

  6. (Optional) If you want to reuse the group, save the group.

    1. Right-click the customized Group page, then click Save Group.

      We recommend using a name that represents the group you built.

    2. Click Save Group and perform the required steps.

      See Saving a Group.