NetWare® provides the following tools to help you manage and tune the memory system:
3.1.1 Using Novell Remote Manager
Novell® Remote Manager contains several pages that can help you understand how your server is using physical and virtual memory and which programs are using it. It can also help you to understand how the logical address spaces for the NetWare kernel are being consumed. Knowing how memory is used can help you determine whether to add more memory to your server to increase server performance, to unload specific NLM™ programs that might be causing memory problems, or to change other settings that might allow the server to use memory more proficiently.
You can also use Novell Remote Manager to load and unload modules to/from protected address spaces, change SET parameter values, and access the server console to execute any console commands.
Using Novell Remote Manager is more useful than using Monitor when diagnosing server memory problems. For more information, see the NW 6.5 SP8: Novell Remote Manager Administration Guide.
This section discusses the following pages in Novell Remote Manager:
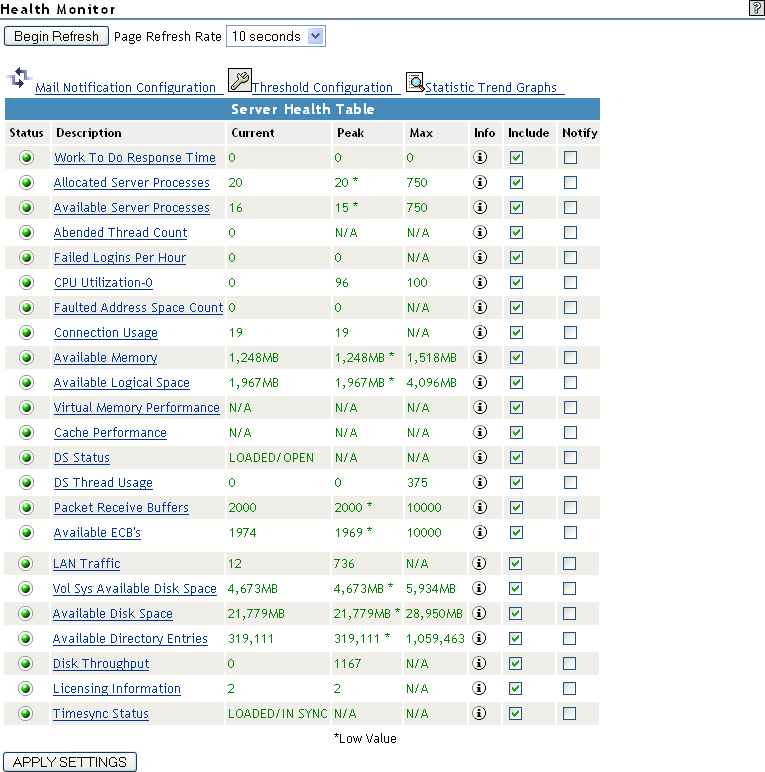
Health Monitor Page
Purpose
Viewing the Health Monitor page in Novell Remote Manager can give you an immediate view of key indicators for monitoring server memory. You can also set thresholds for the monitoring these items and view trend graphs for these items.
Access
To access this page, click under the heading in the navigation frame.
Information Available
The following key indicators for monitoring server memory are available.
You can also set thresholds for monitoring these items and view trend graphs for available memory and available logical space.
To change a thresholds from the default values:
-
Click the link near the top of the page.
-
Click the applicable threshold link.
-
In the applicable fields that you want to change, type the new values.
-
Click .
To view a trend graph:
-
Click the link near the top of the page.
-
Select the applicable check boxes for the trends that you want to view.
-
Click .
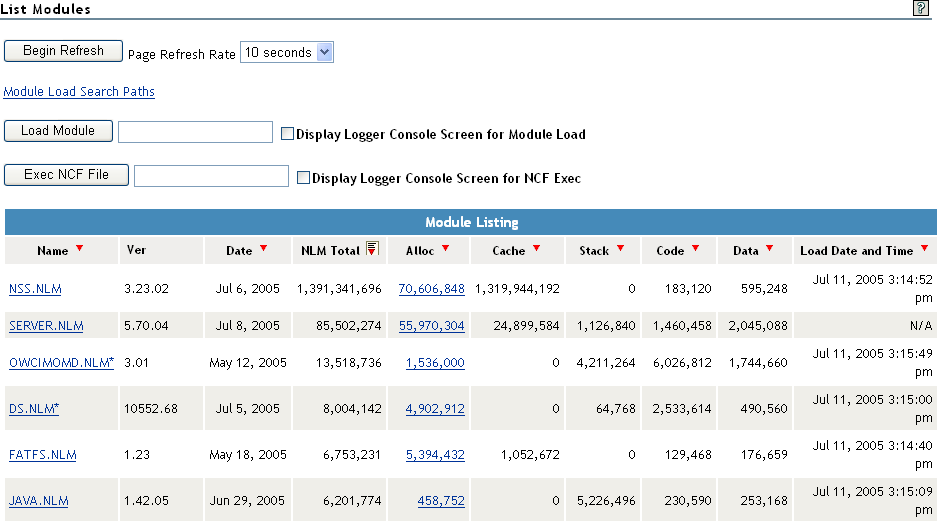
List Modules Page
Purpose
The primary purpose of this page is to view a list of the NetWare Loadable Module™ (NLM) programs loaded on the server. However, the default sort for this page shows which programs are using the most total memory and how that memory is allocated and used by cache, stack, code, and data. Therefore, excluding nss.nlm and server.nlm, which always consume the most memory, you can quickly see which programs are using the most memory.
If the allocated memory keeps growing for an NLM, that program probably has a memory leak and you should quit running it as soon as possible.
Access
To access this page, click link under the heading in the navigation frame.
Information Available
In terms of memory, this page shows or gives you access to the following information:
Table 3-1 NetWare Server Memory Information Types
|
Alloc |
How much memory an NLM has requested from the system and how much it is currently using. The link takes you to a detailed page that shows the breakdown of how the memory is used. |
|
Cache |
How much memory is allocated directly from the file system to cache for each NLM. |
|
Stack |
How much memory is allocated to the NetWare stack for each NLM. |
|
Code |
How much of the allocated memory is dedicated to the code for each NLM. |
|
Data |
How much of the allocated memory is dedicated to data for each NLM. |
The allocated memory values are helpful in determining whether the module is using too much system memory.
The other values help you to see how much memory each NLM needs in order to run.
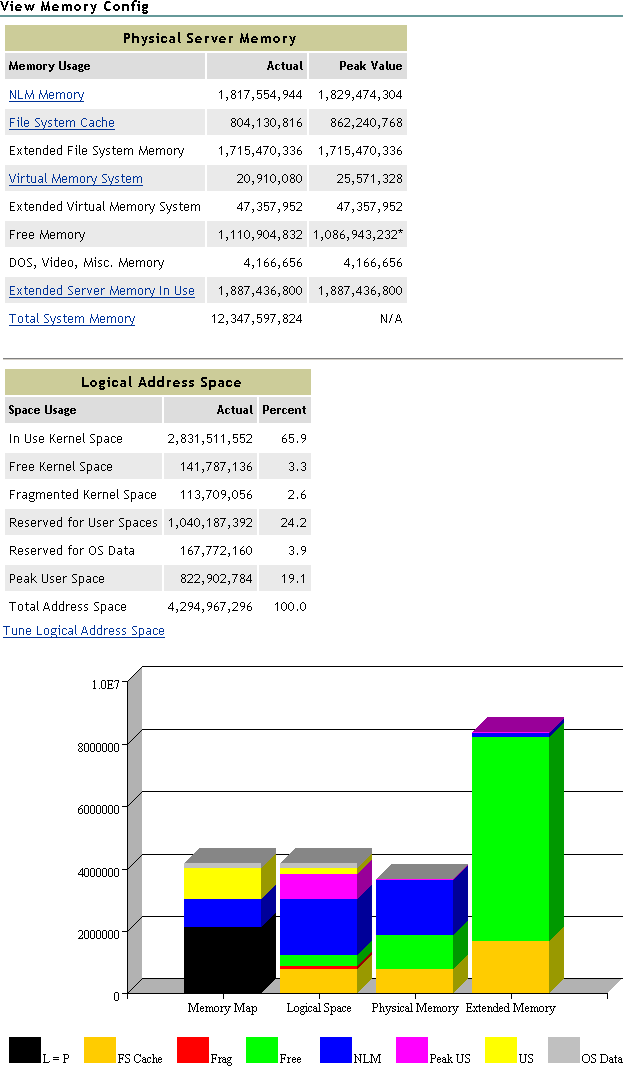
View Memory Config Page
Purpose
This page is helpful when you want to get an overall idea of how the physical and logical memory is being used in your server.
Access
To access this page, click under the heading in the navigation frame.
Information Available
The following table describes the statistic or action of each link shown on the View Memory Config page.
Table 3-2 View Memory Config Page Statistics and Links
|
|
Shows the total physical memory allocated by the operating system to the NLM programs that are loaded on the server.
Links to the List Modules page that shows the details of how each NLM program is using memory. |
|
|
Shows the amount of physical server memory in use by the directory cache buffers in the NSS or Traditional NetWare file system.
Links to the File System Cache Statistics page that shows the details of these cache statistics. Monitoring these statistics over time helps you determine when you might need to install more RAM for cache. See the online help for details of each of the statistics on this page. |
|
|
Shows the amount of physical extended memory (above 4 GB) that is in use by the NSS file system. |
|
|
Shows how much physical memory the virtual memory system is using. The state of the virtual memory system can quickly be determined by the amount of physical memory backing the virtual memory system.
Links to the Virtual Memory Health Information page:
Link to Other Pages:
|
|
|
Shows the amount of extended (above 4 GB) physical memory that the virtual memory system is using. |
|
|
Shows how much memory the server has that is not allocated or reserved as file system cache. |
|
|
Shows how much physical memory is in use before the NetWare operating system loads. |
|
|
In servers that have greater than 4 GB of physical memory loaded, this shows the amount of memory in use and links to the Extended Server Memory Information page that shows the amount of memory in use and available amounts above 4 GB, along with a usage chart. |
|
|
Shows how much total physical memory the server has. |
|
table |
Shows the logical address space information for the NetWare kernel including space in use, available, fragmented, and reserved for User Spaces and OS data. It also shows the peak usage for User Space and the total amount of address space. The User Space reserve is commonly known as Protected Address Space and it always reserves 1 GB of memory whether it is used or not. |
|
link |
Displays the Tune Logical Address Space page that shows the Set parameters to change for best memory performance under the current conditions for that specific server.
To make the changes, click the link next to the parameter you want to accept the changes for and restart the server with the -u command displayed.
Use caution when changing these parameters because they are set to provide the best results for the server while it has been running. If the way the server is used changes, you might need to reset these settings.
The settings are generated dynamically for the specific service at the use level of the server and should not be replicated to any other server. |
|
|
Shows how the logical address space is mapping the physical memory on this machine.
|
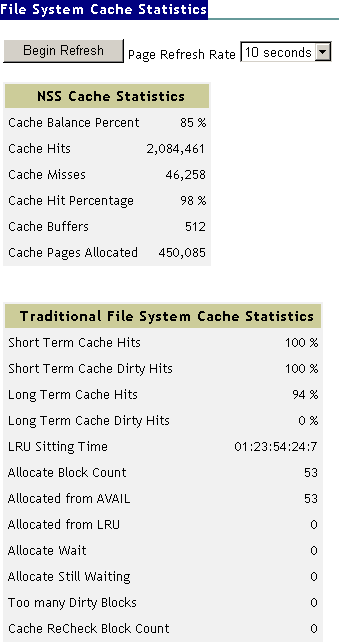
File System Cache Statistics Page
Purpose
This page lets you view File System Cache statistics for this NetWare server. Cache utilization statistics can help you determine when you need to install more RAM for cache.
Access
To access this page in Novell Remote Manager, click under the heading in the navigation frame, then click .
Information Available
The following table describes the cache statistics for Novell Storage Services™ (NSS).
Table 3-3 Cache Statistics for Novell Storage Services (NSS)
|
Cache Balance Percent |
The percent of cache between NSS and the server.
The cache balance percentage determines how many cache blocks NSS will take from the Traditional file system for its own cache.
Every 30 seconds (by default) or when the server loads an NLM, NSS rebalances the NSS file system cache to the percentage specified by the nss /CacheBalance parameter.
You can change the default time interval with the nss /CacheBalanceTimer command. Range: 1 to 3,600
A high cache balance percentage impedes the performance of the Traditional file system. A low cache balance impedes the performance of NSS.
We recommend that you set the cache balance parameter to equal the percentage of the total disk space you allocate for NSS. However, do not exceed 80 percent. You might want to initially set the parameter at 50 percent and adjust this number as necessary.
Default: 60, Range: 1 to 99 |
|
Cache Hits |
Number of requests in the last second for disk blocks that were already in cache memory.
If you allocate more memory to NSS, the cache hit percentage increases. You can add more memory by adding more physical memory, increasing the cache balance, or increasing the minimum number of cache buffers for NSS. We do not recommend lowering the minimum number of OS cache buffers. |
|
Cache Misses |
Number of requests in the last second for disk blocks that were not in cache memory. |
|
Cache Hit Percentage |
Percentage of requests in the last second for disk blocks that were in cache memory.
This is the number of cache hits divided by the number of attempts to get a file cache buffer from the cache. Any amount above 90 percent is good. This means the system is spending less time going to the disk to retrieve data. Lower numbers indicate NSS needs more memory. If this occurs, you might want to set the cache balance percentage higher. |
|
Cache Buffers |
Number of cache buffers used by NSS.
If you allocate too much memory to your NSS cache, you might run the server out of memory. To prevent this, set a minimum amount of RAM aside for the exclusive use of the server operation system.
Default:256, Range: 256 to 1048576 |
|
Cache Pages Allocated |
Number of pages allocated for the cache. |
The following table describes the cache statistics for the Traditional file system.
Table 3-4 Cache Statistics for the NetWare Traditional File System
|
Short Term Cache Hits |
Percentage of requests in the last second for disk blocks that were already in cache memory. (When the requested data is already in memory, disk reads don’t need to be made.) If this value falls below 98 percent, consider installing more RAM for cache. See also compare Long Term Cache Hits. |
|
Short Term Dirty Cache Hits |
Percentage of requests in the last second for disk blocks that were already in cache memory but were dirty. (Dirty cache must be written to disk before being used.) See also Long Term Dirty Cache Hits and LRU Sitting Time. |
|
Long Term Cache Hits |
Cumulative percentage of requests for disk blocks that were already in cache. (When the requested data is already in memory, disk reads don’t need to be made.) Use the cumulative percentage to assess overall disk cache utilization. If this value falls below 90 percent, install more RAM for cache. See also LRU Sitting Time. |
|
Long Term Dirty Cache Hits: |
Cumulative percentage of requests for disk blocks that were already in cache memory but were dirty. (Dirty cache must be written to disk before being used.) Use the cumulative percentage to assess overall disk cache utilization. If this value is high or steadily incrementing, add more RAM for cache. See also LRU Sitting Time. |
|
LRU Sitting Time |
Time elapsed since the block that has been sitting longest in the LRU (Least Recently Used) list was referenced, displayed as DD:HH:MM:SS:TS (days:hours:minutes:seconds:tenths of seconds). Long periods of time indicate that either the server has enough memory to handle requests or the request rate is fairly constant. Short periods of time indicate the server might need more RAM for cache.
If the server has been up for over 24 hours, this statistic should never drop below 24 hours. It is important to understand that LRU Sitting Time is a measure of noncache memory, not file system cache memory. |
|
Allocate Block Count |
Cumulative number of requests for disk cache blocks that have been made since the server was started or rebooted. This value is the sum of the values of Allocated from AVAIL and Allocated from LRU.
If the value of Allocated from AVAIL is much higher, the server has sufficient RAM for cache. If the value of Allocated from LRU is high, install more RAM for cache. |
|
Allocated from AVAIL |
Number of requests for disk cache blocks that were filled by blocks in the available list (blocks that were not being used).
When there are no free blocks available, requests are filled from the Least Recently Used (LRU) list of cache blocks. If this value is much higher than the Allocated from LRU value, the server has sufficient RAM for cache. |
|
Allocated from LRU |
Number of requests for disk cache blocks that were filled by blocks from the Least Recently Used (LRU) cache blocks.
The system writes pending write requests from the LRU cache block to disk and then frees the block for the current request. Because LRU cache is used only when no other cache is available, a steadily incrementing count indicates more RAM is needed. |
|
Allocate Wait |
Number of times a request waited while an LRU block was freed.
Because LRU cache is used only when no other cache is available, a high or steadily incrementing count indicates that not enough cache memory is available. Install more RAM for cache. |
|
Allocate Still Waiting |
Number of times in the last 10 minutes that the operating system waited for an LRU block in order to fulfill a request.
If this value is greater than 7, install more RAM for cache. |
|
Too Many Dirty Blocks |
Number of times a write request was delayed because there were too many writes to perform or the disk channel was busy.
A high value indicates that either the disk channel has too much I/O traffic or you need to install more RAM for cache. |
|
Cache ReCheckBlock Count |
Number of times a disk cache request had to be retired because the target block was being used.
If this value is high or steadily incrementing, install more RAM for cache. |
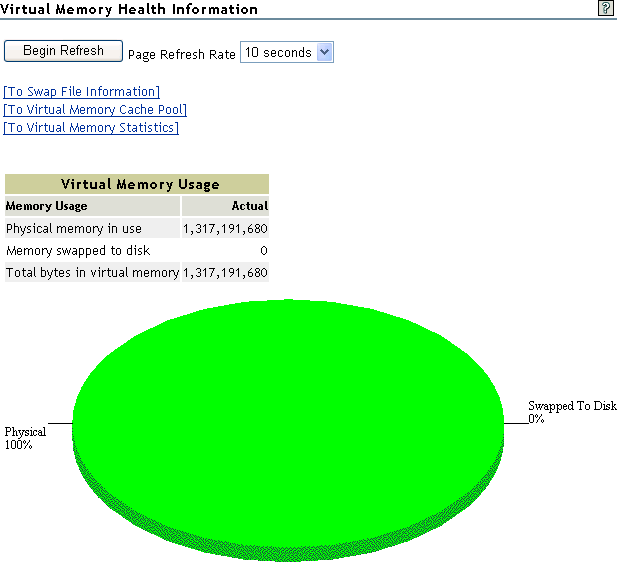
Virtual Memory Health Information Page
Purpose
The state of the virtual memory system is determined by the amount of physical memory backing the total virtual memory system.
If your server is running slow, check the swap space and the amount of physical memory that is backing the physical memory. Keep the swap space as low as possible. We recommend having twice as much physical memory as swap space.
If you continue to need more swap space to keep programs running, you probably need to add more physical memory to the server.
Access
To access this page in Novell Remote Manager, click under the heading in the navigation frame, then click .
Information Available
The following key statistics are shown on the Virtual Memory Health Information page:
The Virtual Memory Health Information page also contains links to additional pages that can help you understand and manage the virtual memory system in the server:
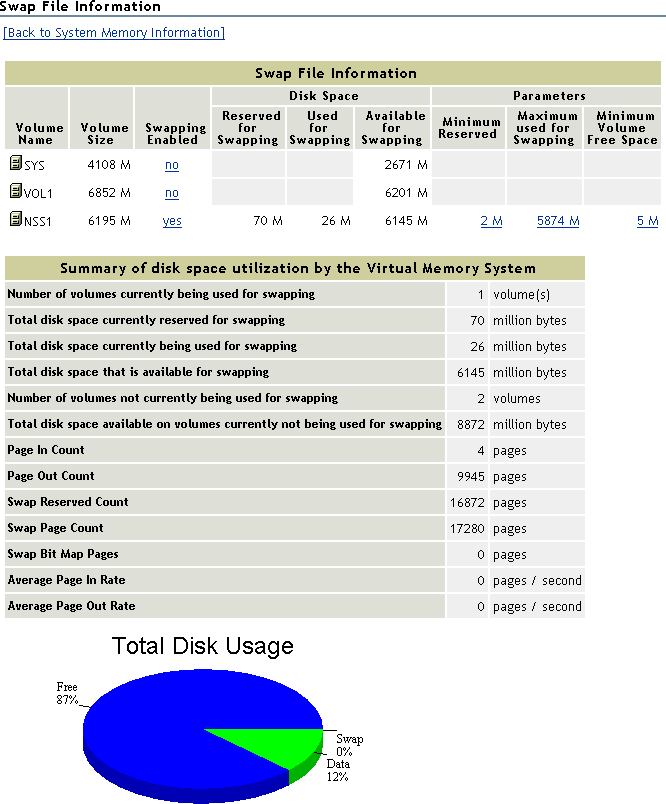
Swap File Information Page
Purpose
This page shows the amount of hard disk space that has been allocated as a virtual memory swap file. Most problems with virtual memory stem from not having enough space designated for the swap file; therefore, make sure you have enough disk space for this.
When the amount of available memory for swapping becomes low, the virtual memory system begins to struggle. If there is no memory available, then the virtual memory system is able to back memory using only physical memory resources. Under these conditions, the virtual memory system will most likely have a performance degradation.
If you find that your server is swapping to disk and its performance is suffering because of it, add more memory to the server.
Access
To access this page in Novell Remote Manager, click under the heading in the navigation frame, then click > .
Information Available
The Swap File Information table shows the following information for each volume in the system.
Table 3-5 Swap File Information Table Descriptions
|
|
Name of each volume. |
|
|
Size of each volume. |
|
|
Whether swapping is enabled or disabled. Lets you enable or disable the swap file by clicking the or links. |
|
|
Size (in millions of bytes) that have been reserved for swapping and the amount of memory the virtual memory system needs to back any virtual memory allocation for each volume. |
|
|
Amount of memory (in millions of bytes) that is being used by the Virtual memory system for each volume. This is the amount of memory that has been actually paged-out to disk. |
|
|
Amount of memory (in millions of bytes) that can still be paged-out to the disk for each volume. |
|
|
Minimum size for the swap file. |
|
|
Sets the maximum size for the swap file. Normally, the swap file is allowed to grow to the size of the volume. However, you can limit the size if necessary. |
|
|
Maximum size for the swap file. This parameter allows the swap file to grow; however, it guarantees that a given amount of disk space will be left free.
For example, if this parameter is set to 10, the swap file will grow only if 10 million bytes on the disk will remain free after the growth. |
The Summary of Disk Space Utilization by the Virtual Memory System table shows the following:
Table 3-6 Disk Space Utilization Summary Description
|
|
Number of volumes that have a currently active swap file. Each volume can have one or no swap file. |
|
|
How much disk space the virtual memory system is actually using. The number should be less than or equal to the reserved amount. |
|
|
How much disk space you can use for all of the swap files. |
|
|
Number of volumes that do not have a swap file on them. For performance reasons, it is better if you allow a swap file on all available volumes unless you have a specific reason for not doing so. |
|
|
How much memory could be used for swapping if there were swap files on those volumes that do not currently allow swapping. |
|
|
Number of pages that have been brought into the virtual memory system from the disk since the server was last restarted. |
|
|
Number of pages that have been sent to the disk by the virtual memory system since the server was last restarted. |
|
|
Number of pages of memory that are reserved in all of the swap files. |
|
|
Number of pages of memory that all of the swap files can back. |
|
|
Number of pages of memory the swap file manager is using to manage the bitmaps for swap file control. |
|
|
Running 5-second average of the number of pages that the virtual memory system has paged-in from the disk. |
|
|
Running 5-second average of the number of pages that the virtual memory system has paged-out from the disk. |
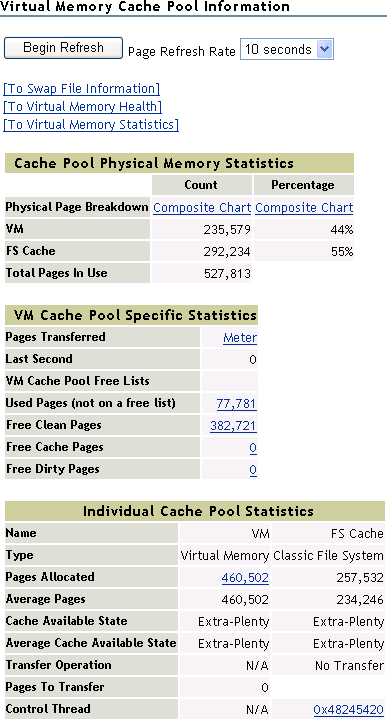
Virtual Memory Cache Pool Information Page
Purpose
This page shows statistics for the physical memory cache pool, virtual memory cache pool, and individual cache pools. See the online help on this page for details about each of these statistics. This page is more useful for developers who are trying to understand how memory in the system is being used by an NLM program that they are developing.
Access
To access this page in Novell Remote Manager, click under the heading in the navigation frame, and then click > .
Information Available
Virtual Memory Statistical Information Page
Purpose
This page contains virtual memory statistical information. This information shows you what is happening in the virtual memory system when the VM Cache Pool Percentage parameter is set. We recommend setting this parameter and letting it control the system rather than trying to tweak the system yourself.
Access
To access this page, click under the heading in the navigation frame, then click > .
Information Available
The page shows the following virtual memory statistical counters:
Table 3-7 Virtual Memory Statistical Counters
|
Current Available Memory |
Amount of physical memory that is available to the virtual memory system. |
|
Free Desired Pages |
Number of pages that the virtual memory system needs for proper operation. |
|
Free Lots Pages |
Number of available pages that the virtual memory system finds excessive.
Having an available page count beyond this number can result in pages being given to another cache pool. |
|
Free Minimum Pages |
Minimum number of pages that the virtual memory system needs for proper operation. |
|
Memory Available State |
Current state of the virtual memory system. There are six possible states:
-
Desperate
-
Poor
-
Fair
-
Normal
-
Plenty
-
Extra-plenty
|
|
Need Free Clean Pages |
If the value is not 0, this flag indicates that the virtual memory system needs some clean pages to operate properly. |
|
Need Free Pages |
If the value is not 0, this flag indicates that the virtual memory system needs some free pages. |
|
Upper Page I/O Threshold |
Controls an alert that triggers when the server has had too many page I/Os recently.
This is an indication that the virtual memory system is thrashing because of too little physical memory resources. |
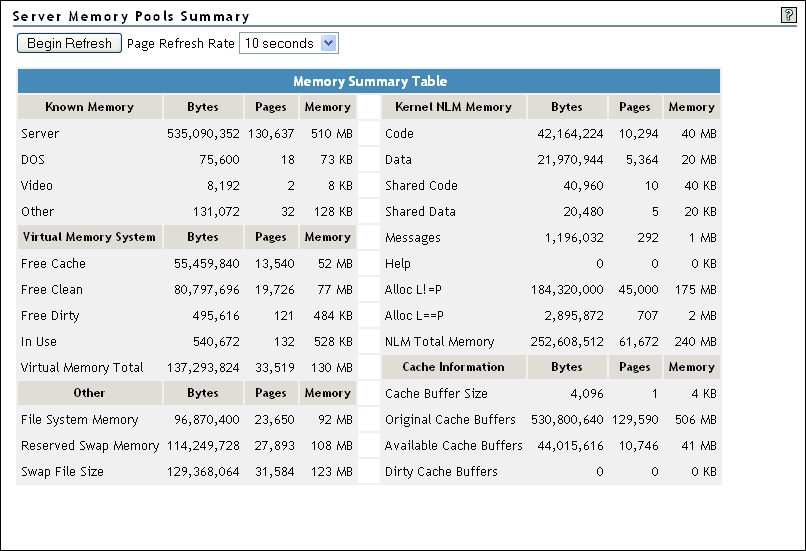
Server Memory Pool Summary Page
Purpose
This page shows a summary all of the server memory detailed statistics.
Access
To access this page, click under the heading in the navigation frame, then click .
Information Available
The Server Memory Pools Summary shows the following information for each type of memory in the server. The amounts consumed are shown in bytes of disk space, pages, and memory used.
Table 3-8 Server Memory Pools Summary
|
Known Memory |
Distribution of the known memory among DOS, video buffers, and the server memory pool. |
|
Kernel NLM Memory |
How NLM programs loaded in the OS address space of the NetWare server are using memory.
The Alloc L!=P category shows NLM memory allocations using mapped memory where the logical address of the memory does not equal the physical address of the memory. This is the normal state of most NLM memory allocations.
The Alloc L=P category shows memory allocations where the logical and physical addresses of the memory is the same. This type of memory allocation is done mainly for Direct Memory Access (DMA) used by device drivers that cannot handle different logical and physical addresses. |
|
Virtual Memory System |
Memory usage by the NetWare server virtual memory system. |
|
Cache Information |
Original, current, and dirty cache buffer information.
Original Cache Buffers: Amount of memory available to the server cache when the server first came up.
Current Cache Buffers: Amount of memory available now for file caching and memory allocations.
Dirty Cache Buffers: Server cache memory pages that have data in them that needs to be flushed to disk. |
|
Other |
File System memory, reserved swap memory, and the swap file size information.
File System Memory: Amount of server memory in use by the directory cache buffers in the Traditional NetWare file system.
Reserved Swap Memory: Small footprint of reserved memory that allows the NetWare operating system to point to the physical location of the actual swap file.
Swap File Size: Amount of hard disk space that has been allocated as a virtual memory swap file. |