8.1 Monitoring Server Health
Monitoring the health of your server can help prevent it from getting to a state in which your users cannot access the server or the data on it. Monitoring your server’s health involves the following tasks:
8.1.1 Monitoring Overall Server Health or the Health of a Specific Item
Using Novell Remote Manager, you can monitor the server’s overall health and the health of a specific item.
Health Status
The server’s overall health is indicated by the color of the circle displayed next to the icon  in the header frame for Novell Remote Manager. The following table lists and explains each health status that might be displayed.
Table 8-1 Server Health Status
|
Icon |
Server Health Status |
Explanation |
|---|---|---|
|
|
Good |
All parameters included in the server's health configuration list are good. |
|
|
Suspect |
The status of one or more of the parameters included in the server's health configuration list is suspect or has a minor problem. |
|
|
Bad |
The status of one or more of the parameters included in the server's health configuration list is bad or has a critical problem. |
|
|
Lost connection |
The connection to the server from Novell Remote Manager has been lost. |


The server’s overall health is determined by items that are selected in the list on the detailed Server Health page as shown in Figure 8-1. By default, all items are selected.
Figure 8-1 Server Health Page
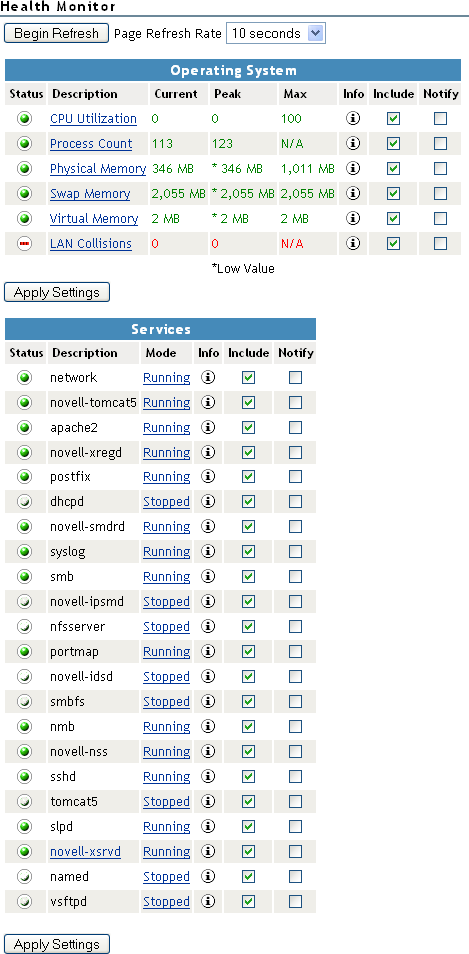
If the status of any item that is selected in the list changes to yellow (suspect) or red (bad), the health status indicator light in the header frame changes to indicate there is a problem. If more than one item changes, the worst status indicates the server’s overall status. When the status for all items returns to green (good), then the health light indicator changes back to green (good).
Health Status Refresh Rate
The server’s health status, reported by the health status indicator, is updated every five seconds, but the graphic refreshes only if the status changes.
-
To modify the refresh rate, select a rate from the drop-down menu, then click . The selected refresh rate applies to this page only, and persists until you modify the value.
-
To stop refreshing the page, select . The page does not refresh until you click .
-
To begin refreshing after stopping, select . The last used refresh rate is applied automatically when it begins.
Operating System Health
The table on the Server Health page shows the health status (green/good, yellow/suspect, or red/bad) for all known components of the operating system, as well as current, peak, and maximum values. When an item is not selected in the list, it is not included when determining the overall server health and the values for , , , and are not displayed.
The following items in the table are key indicators of your server’s health:
-
CPU Utilization (for each processor, if there is more than one)
-
Process Count
-
Available Memory
-
Physical, Swap, and Virtual Memory
-
LAN Collisions
IMPORTANT:You must click the button below the table to apply your changes to values in that table. If you leave the page without applying the changes, the settings return to their saved values.
In this release, you cannot change the thresholds for the and values of these indicators. See the online help for each parameter to see the set thresholds.
To access the Health Monitoring page, click one of the following links:
-
icon
-
 icon in the header frame
-
link in the navigation frame
Services Health
The table on the Server Health page also shows the health status of the services installed on the server as well as their online or offline status. When a service is offline, the health status of the service is not included in the server’s overall health whether or not it is selected in the list.
The mode indicates that the server is running or stopped. To change the mode of the service, click the mode link for that service. The mode page opens for the service where you can start, stop, or restart the service by clicking the applicable button.
You can modify the and settings in the table by selecting and deselecting the check boxes in those columns, then clicking below the table.
IMPORTANT:You must click the button below the table to apply your changes to values in that table. If you leave the page without applying the changes, the settings return to their saved values.
8.1.2 Configuring the Items to Monitor
As stated in the previous section, the server’s overall health is determined by items that are selected in the list on the detailed Server Health page. By default, all of the items are selected.
Therefore, if you have a server that has specific parameters that you know will cause a suspect or bad status and you want to be notified only when other parameters have changed, you can remove the items with the suspect or bad parameters from the and lists by deselecting them and clicking . You need to apply the settings for the Services items separately from the Operating System items.
8.1.3 Configuring Email Notification for Server Health Status
Rather than manually checking the status, you can configure Novell Remote Manager to send an email to notify you when the server’s health status changes to any value other than green (good).
-
Select the check box for the item on the Server Health page.
-
Specify the required information for email notification in the /etc/opt/novell/httpstkd.conf file.
You can edit this file via the link provided on the Configuration Options page.
-
After changing the /etc/opt/novell/httpstkd.conf file, restart HTTPSTKD.
Click the button on the Configuration Options page or execute the following command in a console shell on the Linux server:
rcnovell-httpstkd restart