Financial Management Applied
Financial Management can be used to forecast the costs for offering
a Service and can also calculate the amount that should be charged to
the Service Users in order to recover costs.
To use Financial Management as a tool for calculating the financial
value of the underpinning infrastructure that provisions services and
to qualify operational forecasts, you need to:
Provide the User access to the functionality
Enable SLA costing functionality
Enable the functionality within the Category
Create the Item Type and enter forecast figures
Create the Service Item, which automatically
applies the forecast figures
Build the relationships between the Service
and underpinning hardware and software, to associate actual costs
Use Finance Reports to compare forecast costs
with actual costs, and chargeback costs to the Org. Unit Users.
Enable Financial Management Access
To access the Financial Management functionality a User must be assigned
the Finance Role within the Information tab of their User Information
screen. Assigning the Role within a system synchronized with an authentication
server, the system administrator needs to include the User in the Finance
group in LDAP.
To switch on the functionality for an existing User in a system not
synched with an LDAP server, as a Supervisor:
Select the User >
Users tab
Click on the Name hyperlink
of the relevant User
Select Edit
Tick the Finance box
in the Roles field
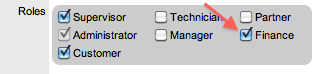
Click Save.
The User can now access the Finance Management functionality within
the consolidated User view.
Enable Functionality
Financial information can only be calculated for Service Items that
are created using a Category, which has the Service Category option enabled.
By enabling this option, the Costs Tab is made available with the Item
Type where baseline figures can be recorded.
As a User with the Finance Role:
Move to the Configuration
> Categories tab
Click the Service Item
Category hyperlink
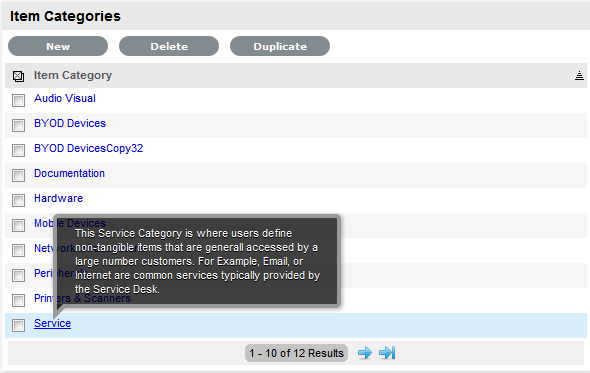
Verify the Service
Category option is checked
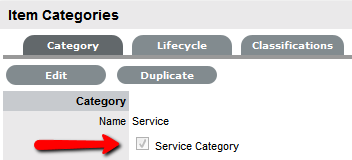
Click Done.
Charging for Service
If the service and support organization is to charge Organizational
Units, that is companies or departments, for the ongoing service they
provide the costing functionality for the Service Level Agreements (SLAs)
needs to be enabled, and the Prices for the different Agreements need
to be assigned to each of the SLAs.
As a User with Administrator access, within the Setup screen:
Select Setup > Billing
Click Yes for the Display
SLA Prices option
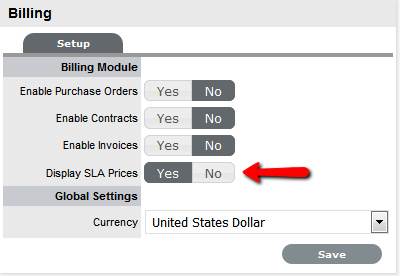
Click Save
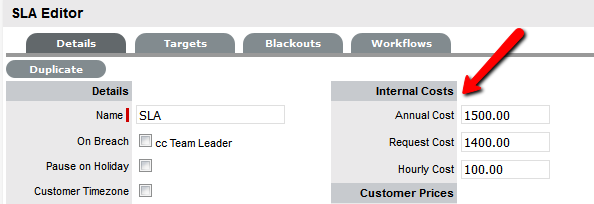
The Annual, Request and Hourly Price fields are now made available
within an SLA Editor screen.
Switch to the User Portal
to access the Supervisor view
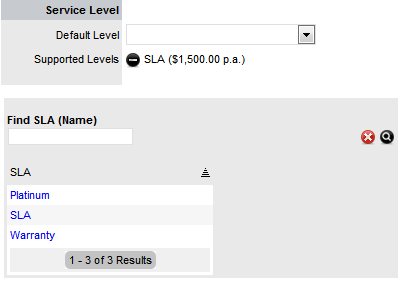
Move to the Service
> SLAs tab
Select the Name hyperlink
for an SLA
The SLA Editor is now displayed.
Click Edit
Enter the relevant figure
in the Annual Price field
The Annual Price entered should be the per User, per year price for
the SLA.
Click Save and Done.
Repeat the process for all relevant SLAs configured in the system.
For detailed information about configuring SLAs see Creating
SLAs.
Forecast Service Costs
When proposing a Service as part of Service Portfolio Management, the
investment and ongoing costs for offering a Service can be calculated.
This information can then be used to project potential revenue for offering
the Service and allow consumers of the Service to be charged for accessing
the Service based on User access. For an example, we will use the Service
Desk Service, considering the investment in hardware and software plus
the ongoing SLA expense for offering the Service, when forecasting costs.
To forecast the cost of offering a Service, as a Financial User:
Move to the Configuration
> Types tab
Select the default Service
Desk Item Type
If creating a new Item Type refer to Creating
Item Types.
Click Edit
Search and select the
relevant SLAs for the Supported Levels field
This is where SLAs that have Prices are associated with them.
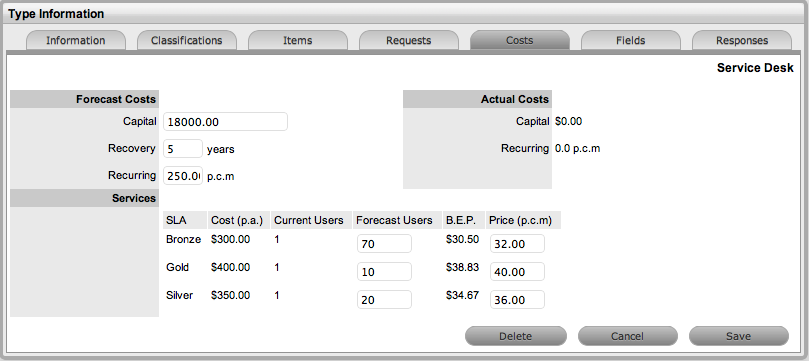
Move to the Costs Tab
The Capital, Recovery and Recurring cost fields are now displayed.
Complete the following
fields:
Costs |
|
Capital |
Enter
the sum total to be invested in hardware and software infrastructure
that will underpin the Service. |
Recovery |
Complete
the field with the number of years designated to recover the
costs of implementing the Service. |
Recurring |
Enter
the ongoing cost, on a per calendar month basis, for offering
the Service. For example, annual support and maintenance agreement
costs charged on a monthly basis. |
Services |
Using
the details entered in the Costs fields and the cost per annum
of the SLA, enter the forecast number of Customers/Users to
calculate the break even point (B.E.P) of the Service. Using
the auto-calculated B.E.P., enter a per calendar
month Price for the Service to recover costs. This figure
is used in the
Service Item Costs tab to calculate the ongoing Revenue
figures.
If an SLA
with an Internal Cost is assigned to the Type, the B.E.P
will be the SLA cost divided by 12 plus the cost of recovering
the Capital expenditure over the number of years defined
for the Capital to be recovered. For example, where the
SLA cost is $240 for the year, the B.E.P will never be
less than $20 per month. |
Actual
Costs |
Capital |
Content
for this field is derived from the Cost field within the Costs
tab of the Item created using this Type. |
Recurring |
Content
for this field is derived from the Monthly Cost field within
the Costs tab of the Item created using this Type. |
Enter a figure in the
Forecast Users field for each SLA
(The displayed SLAs are based on the ones assigned to the Supported
Levels field in the Information tab.)
If multiple SLAs are assigned to the Item Type and Forecast Users are
assigned to each SLA, the Costs are divided by the total number of
Forecast Users as calculated across the SLAs to arrive at the B.E.P.
The system does not differentiate between who the Users are, it only
accounts for the number of Users
Enter the Price for
the Service to recover costs in a per calendar month
Use the calculated Break Even Point (B.E.P.) to set the Price. This
figure is then used as a comparison figure for the Actual cost in
the Service Item Costs Tab.
Click Save and Done.
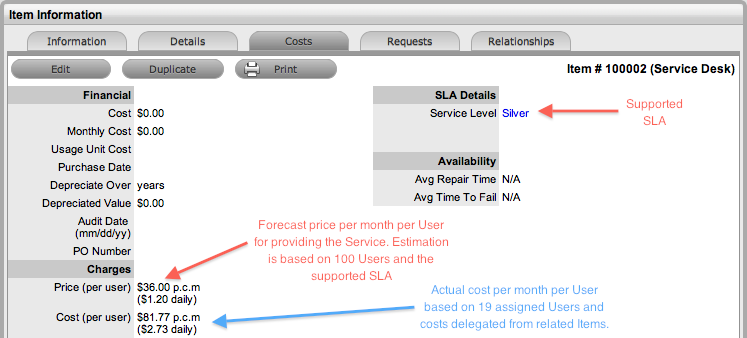
The forecasted Price per User is now available within the Charges Price
field on the Costs tab of the Service Item.
Calculate Actual Service Costs
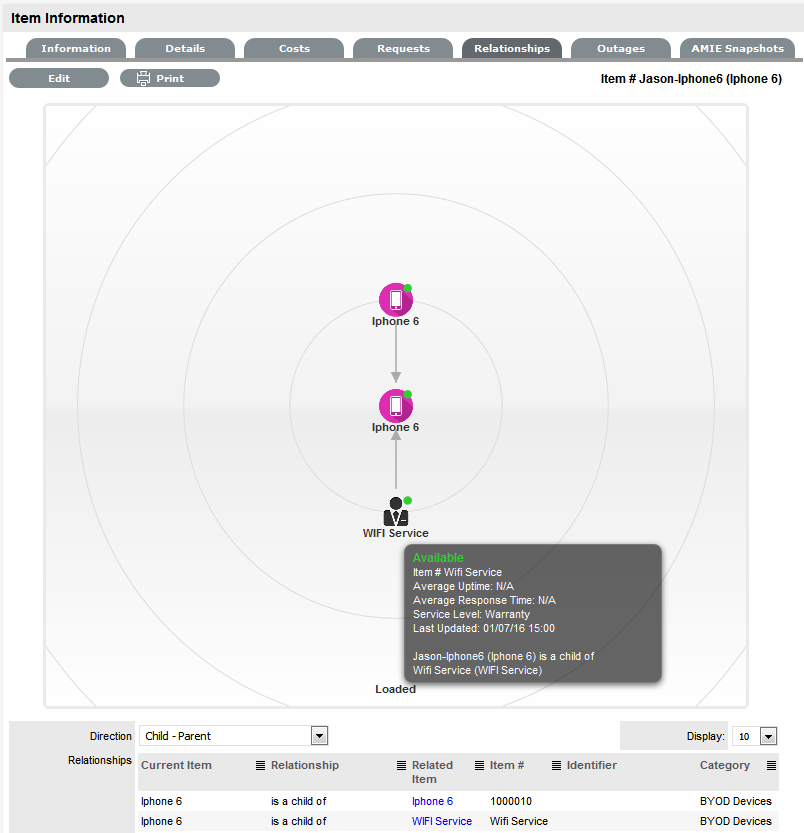
To calculate the actual Service Costs, the relationships
of the infrastructure Items that underpin the Service need to be mapped
within the Relationships tab. Working with these relationships, it should
be noted that the Service is considered a Child Item within the hierarchy.
To build the relationship map refer to the Relationships
Tab.
After the underpinning infrastructure and its associated
costs are related to the Service Item, the following financial information
is available in the Service Item Costs tab:
Financial |
Description |
Cost |
The
financial investment made to purchase the Item. This figure is
also used when the Delegate Costs is enabled for allocating costs
across related Items.
|
Monthly
Cost |
The
amount invested on a monthly basis to maintain the running of
an Item. This figure is also used when the Delegate Costs option
is enabled for allocating costs across related Items. |
Usage
Unit Cost |
This
is used as a reference field, where the User can enter base unit
cost, for example per Megabyte data charge, which can be used
for calculating costs in custom reports. |
Purchase
Date |
The
date the Item was purchased. |
Depreciate
Over |
Enter
the number of years the Item is to be depreciated over, if required. |
Depreciated
Value |
The
system calculates the current value of the Item based on the Purchase
Date and the number of years the Item is to be Depreciated Over. |
Audit
Date |
Set
the date the Item is next to be audited. |
PO
Number |
If
Purchase Orders are enabled for the system, the field is visible
and automatically populated with the PO number generated by a
User within the Finance>Purchase Orders tab, when the Item
order was recorded in the system. |
Charges |
Price
(per user) |
Draws
the figure from the Service
Item Type Costs tab and displays this as a daily amount. This
figure is then multiplied with the number of Users/Customers assigned
to the Item, to calculate the forecasted Revenue. |
Cost
(per user) |
Draws
the figure from the Inherited Costs and displays this as
a daily amount. This figure is then multiplied with the number
of Users/Customers assigned to the Item, to calculate the actual
Costs. |
Revenue |
Month
to Date |
Uses
the Charges Price figure, multiplied by the number of Users and
days of month passed, to calculate the month to date figure. |
Previous
Month |
A
reference figure for an average monthly revenue figure, based
on the previous month's revenue for the Service Item. |
Costs |
Month
to Date |
Uses
the Charges Cost figure, multiplied by the number of Users and
days of month passed, to calculate the month to date Cost. |
Previous
Month |
A
reference figure for an average monthly cost, based on the previous
month's cost for the Service Item. |
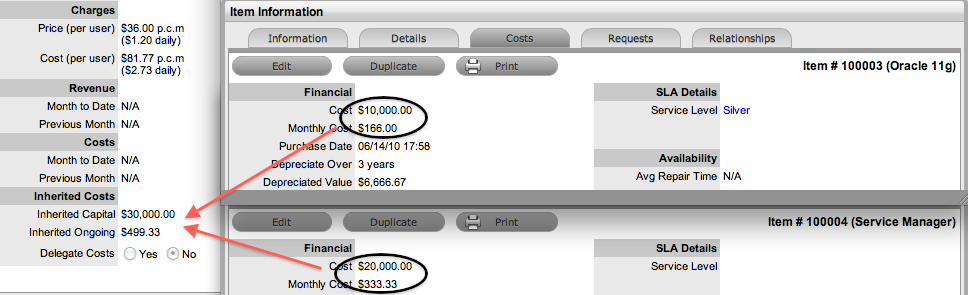
Inherited Costs |
Inherited
Capital |
Total
infrastructure costs of parent CI's that directly contribute to
the cost of the Service Item. This figure is derived from all
the Cost fields within the Item Information>Costs tab of related
Parent Items. |
Inherited
Ongoing |
Running
costs of all associated Items that enable the Service Item to
continue to function. This figure is derived from all the Monthly
Cost fields within the Item Information>Costs tab of related
Parent Items. |
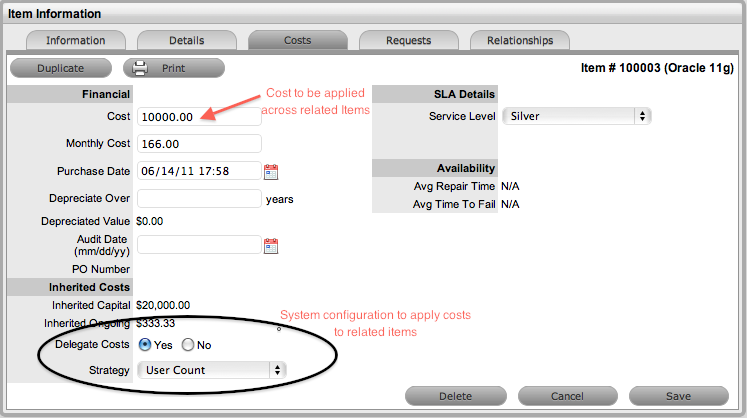
Delegate
Costs |
To
enable cost delegation across the relationship map allowing
associated Items to inherit the costs of the current CI,
select Yes. This will take the figures from the Cost and Monthly
Cost fields for the Item and spread them across related Child
Items.
Define the technique
to be used to evaluate the cost split:
Child
Count:Costs are split by percentage based on the number
of child CI's the costs are being delegated across.
User
Count:Costs are split proportionally based on the number
of users of the child CI's the costs are being delegated across.
Custom
%: Allows for the % cost to be assigned within the relationship.
To do this, within the Service Item Relationships tab, all Items
within the defined relationship map must have the same setting
and then the Cost Split % can be set within the table included
on the Relationships tab by clicking on the 0.00 link. Note, if
a N/A link is visible within the Cost Split % column, then that
Item does not have the Custom % option selected. |
Availability |
Avg
Repair Time |
Entries
displayed here are automatically calculated based on the average
length of time an Item is offline. |
Avg
Time To Fail |
Figures
displayed here are automatically calculated based on the average
time between an Item being moved to an offline State. |
Inherited Costs
Charging Organizational Units appropriately for a Service can be based
on figures derived from the Items associated with the Service. For example,
the Service Desk is hosted on a server and uses service management software.
The costs associated with the server and software are combined to make
the Inherited Capital cost, while any ongoing support contracts would
be assigned as an Inherited Ongoing cost on a per month basis.
To derive the amounts from the related infrastructure and populate the
fields within the Child Item, the Delegate Costs field must be enabled
within the Inherited Costs for the Parent Items and the technique for
deriving the cost must be assigned to the CI.
In the Service Desk example, for the server hosting the Service Desk
Service it would be appropriate to delegate costs applying the Child Count
technique as multiple software/service CIs may be associated with the
server. While, the User Count would be used to delegate costs to the service
management software.
After the relationships have been defined for the Service and the Inherited
Costs applied, the Finance User can verify the forecast numbers by comparing
the Inherited Costs within the Item>Costs tab, to the Capital and Recurring
Costs recorded in the Item Types Costs tab. Any disparity between the
figures should alert the Finance User as to whether the Service is within
budget and if relevant, making or costing money.
Finance Reports
The Finance User can access the following Reports within the Reports>Finance
tab, to assist with verifying the cost and revenue generated by a Service,
and monitoring how a Service is used.
Finance
Reports |
Description |
Service Cost |
The cost of providing a Service is calculated
nightly and saved, along with the revenue figures, in the ITEM_REVENUE
table.
The cost of the Service includes all the cost
factors and saves a figure each night, per service, per cost centre.
This is the sum of these for a Service. |
Service Revenue |
The price charged for providing a Service
is calculated nightly and saved, along with the cost figures in
the ITEM_REVENUE table.
The price charge for the Service is determined
in the cost calculator configured in the Service Item
Type. |
Total Service Cost |
The cost of providing a Service is
calculated nightly and saved, along with the revenue figures,
in the ITEM_REVENUE table.
The cost of a Service includes all the cost
factors and saves a figure each night, per service, per cost centre.
This is the sum of these across all Services. |
Total Service Revenue |
The price charged for providing all Services
is calculated nightly and saved, along with the cost figures in
the ITEM_REVENUE table.
The price charge for the Service is determined
in the cost calculator configured in the Service Item
Types associated with all Services. |
Service Consumption |
Uses the total number of consumers of a
service as recorded in the ITEM_REVENUE table, which is broken
down by cost centre,
to illustrate how the number of consumers
of a service varies over time. |