4.1 Security Pages
The Security pages are where the majority of patch-related activities are performed, to include monitoring all patches across all systems registered to the ZENworks Server. From here you can assess patch compliance, view recently released patches, check patch subscription status, check the last time each device was scanned for patch compliance, search for patches, create custom patches, create and manage patch policies, and more.
4.1.1 Employing the Security and Patch Dashboard
The Patch Dashboard has four default dashlets that provide a comprehensive snapshot of key indicators, so you can quickly assess the overall health and compliance of patches on devices in your zone. You can also initiate action directly from respective dashlets, when expanded, to remediate, download, or disable selected patches, to discover patches, to reconfigure the zone vulnerability detection schedule, and to view patch and device details.
The Security Dashboard has four dashlets that enable you to quickly assess the vulnerability status of your zone. Using these dashlets you can track patches and CVEs, identify the top CVEs in the zone and the CVE severity distribution details. Using these dashlets you can deploy remediations, and perform patch scans.
Custom dashlets: You can create custom dashlets from any of the default dashlets or from other custom dashlets using the feature. This will save the filter settings on a custom dashlet until you change and save different settings. Unlike the filters on the default dashlets, the filters you set on custom dashlets are persisted beyond the current Dashboard page session.
System settings: Dashlets that can be filtered by Platform reflect patches from the platform types selected in the Subscription Service Content Download configuration. For example, if the Linux platform is the only platform type selected for “platforms to download,” then typically only patches from that platform will be shown or can be filtered in the dashlet.
One exception to the above statement is custom dashlets. Any applicable patches already downloaded before a change was made in the “platforms to download” would still be shown in applicable ‘custom’ dashlets if the excluded platform type was previously saved to show in the dashlet.
Patch dashlet descriptions: A brief description for each default dashlet is provided below. Click a dashlet link for more detailed information about that dashlet.
-
Patch Subscription Status: Displays the number of known patches in the zone, their status, and the last start and end times of subscription activities for licenses, patch discovery, and patch download. Mouse over different sections of the chart to see end times for Patch Download, License Verification, and Patch Discovery, or expand the dashlet for more options.
-
Recently Released Patches: Displays the number of recently released patches by patch impact type. Mouse over different sections of the chart to see the number of patches for each impact type, or expand the dashlet for more options.
-
Device Patch Compliance: Displays compliance status for devices in the zone. Mouse over different sections of the chart to see how many devices are compliant, or expand the dashlet for more options.
NOTE:Patch compliance is measured by Critical and Recommended patch impacts, based on the percentage defined in the Dashboard and Trending configuration. Disabled patches for these impact types are not part of the compliance data.
-
Device Last Patch Scan: Displays the number of devices scanned for patches by time range. Mouse over the chart to see the scan information, or expand the dashlet for more options.
Security dashlet descriptions: A brief description for each default dashlet is provided below. Click a dashlet link for more detailed information about that dashlet.
-
Patch Tracker Dashlet: This dashlet is a unique dashlet when compared to other dashlets in ZENworks as it does not display any data by default. To view the data, the dashlet should first be configured. When you mouse over the dashlet, it displays the number of vulnerable devices against the total number of impacted devices for the selected patches. In the Vulnerability Trend section of the dashlet, you can view the vulnerability trend of the selected patches, for a specific time period.
-
CVE Severity Distribution: Displays all the CVEs that are applicable to devices in the zone, grouped based on their severity. When you mouse over the dashlet you get to see the number of CVEs for each type of severity.
-
Top CVEs: Displays the list of top CVEs in the zone based on the date on which they were released. However, you can use the filters to display the top CVEs based on the number of vulnerable devices or based on the severity. Mouse over different sections of the chart to see the number of vulnerable devices against the total number of impacted devices, for a particular CVE.
-
CVE Tracker: The CVE Tracker dashlet also does not display any data by default. To view data, the dashlet should first be configured. When you mouse over this dashlet, it displays the number of vulnerable devices against the total number of applicable devices. In the Vulnerability Trend section of the dashlet, you can view the vulnerability trend of the selected CVEs, for a specific time period.
For general information about using the ZENworks Dashboard, see Using the ZENworks Dashboard - An Overview.
Patch Subscription Status
All patching through ZENworks Patch Management begins with retrieving applicable patches into your system via the patch subscription service. The subscription service performs three tasks: it verifies that your license is valid, it discovers new patches that are applicable to devices in your system, and it downloads the patch content as it is needed.
Viewing the Subscription Status is your first indication that your patch process is running smoothly. Use this dashlet to quickly determine the status and end times of these three processes: License Verification, Patch Discovery, and Patch Download. If any of the processes have failed, you have your first indication of where to troubleshoot:
-
License Verification: Check the Patch Management License page to verify that your license has not expired.
-
Patch Discovery: Click the link in the Subscription Status dashlet to scan for new patches in the patch content repository. If new patches are detected, the patch signatures will be downloaded to your devices, so they can be detected in the next DAU scan.
-
Patch Download: Check your network environment to ensure patch content is not restricted due to closed ports or other firewall issues. For more information, see Patch Management Issues.
Recently Released Patches
By default, the Recently Released Patches dashlet displays all applicable patches discovered on devices in your Management Zone that were released in the last 30 days. Viewing the information in the default configuration might initially help you determine how to best configure the dashlet for your organization’s needs by asking questions such as:
-
What platform types do I need to patch?
-
What patch impact types do I want to include?
-
Do I want to see applicable patches from all vendors or just selected vendors in my dashboard?
From the expanded Recently Released Patches dashlet, you can configure the dashlet to only display those patches that you require to accurately assess your patch environment going forward. You can also create custom dashlets by saving the Recently Released Patches dashlet with another name.
Modify the data display: To filter the data that the dashlet displays, expand and modify any of the sections in the dashlet filter panel for Release Period, Platform, Impact, and Vendors, and then apply your changes.
Execute actions from the Patches panel: The Patches panel displays the patches that meet the criteria you define in the dashlet filter panel. You can also filter the list by searching for any portion of a patch name string via the feature.
For information about other actions and options you have in the Patches panel, see the following:
-
Remediate patches: If you see a patch that you need that will not be picked up by your patch policy, you can start remediation of the patch directly from the Patches panel. To start remediating patches, select one or more patches in the list, and click .
Step 1 in the remediation process opens. For information about using the Remediation wizard, see Deploying Patches Manually.
-
Disable patches: To disable one or more patches, select them in the Patches panel and click .
NOTE:There is no confirmation of this action. Once you click , the action is executed.
To enable a disabled patch, go to the page, locate and select the patch, and click from the Action menu.
-
Download patches: To download one or more patches, select them in the Patches panel, and click . A green status icon indicates that the patch or patches are downloaded.
-
View patch information: To view vendor details about a patch, click the patch name in the Patches panel. The Patch information page provides useful details about the patch and a link to the vendor site.
-
View patched or not patched devices: To see which devices are applicable to which patches, click the applicable number link in the Patched or Not Patched column. This will list the devices that already have or need that patch, respectively. The list of devices will also include a link to the Summary page for each device in the list.
-
Sort the Patches list: To sort the list alphanumerically by column criteria, click a column header. Clicking the column a second time will invert the order of the sort.
Device Patch Compliance
When expanded, the Device Patch Compliance dashlet provides a quick snapshot of how many devices are compliant and how many are not, both by the number of devices in the chart and by percentages in the Devices panel. You can modify the threshold that you want for patch compliance in the Dashboard and Trending configuration. For more information on this setting, see Configuring Patch Dashboard and Trending.
Modify the data display: To filter the data that the dashlet displays, expand and modify any of the sections in the dashlet filter panel for Status, Impact, Device Type, and Platform, and then apply your changes.
Viewing options in the Devices panel: The Devices panel displays compliance status for each device in your zone by percentage, based on the criteria you define in the dashlet filter panel and compliance criteria in the Dashboard and Trending Configuration. You can also filter the list by searching for any portion of a device name via the feature.
To see specifically which patches are compliant for each device, click a percentage link in either the Critical Patches or Recommended Patches column for a device in the list, and the Patches page will open for that device.
Device Last Patch Scan
Checking the data in the Device Patch Last Scan dashlet can help you determine the health of your current patch environment. When expanded, you can compare the latest scan with information from other patch dashlets and even go directly to the Vulnerability Detection Schedule to modify scan times, if there is a need.
Modify the data display: To filter the data that the dashlet displays, expand and modify any of the sections in the dashlet filter panel for Time Ranges, Platform, and Device Type, and then apply your changes.
Viewing options in the Devices panel: The Devices panel displays the last scan date and the next scheduled scan time for each device.You can also filter the list by searching for any portion of a device name via the feature.
For information about other actions and options you have in the Devices panel, see the following:
-
View detailed device information: To see specific information about a device in the Devices panel, click the device name.This will open the Summary page for that device.
-
Modify the scan schedule: To go directly to the Vulnerability and Detection Schedule in the Patch Management configuration, click the link in the column for any of the devices in the Devices panel. From here, you can modify the zone schedule that checks for device vulnerability.
-
Sort the Devices list: To sort the list alphanumerically by column criteria, click a column header. Clicking the column a second time will invert the order of the sort.
Patch Tracker Dashlet
The Patch Tracker dashlet enables you to track a single or multiple patches available in the Management Zone. By drilling into the dashlet, you view the current patching status of the devices and also view the patching trend over a defined date range.
You can customize the dashlet to best fit your needs, and create multiple custom dashlets if necessary.
By default, the Patch Tracker dashlet does not display any information, to view information in the Patch Tracker, you need to first configure the dashlet. By configuring the Patch Tracker dashlet, you can track a single patch or multiple, associated, patches.
For the specified patches you can view the current patching status of the devices. The dashlet displays the number of devices that are patched against the total number of applicable devices. After identifying the vulnerable devices, you can use the Deploy Remediation quick task to apply the patches on the devices. With the Patch Tracker dashlet you can view the updated status as devices are patched. In the Unpatched Device Trend section of the dashlet, you can view the patching trend of the selected patches, for a specific time period.
Accessing the Dashlet: In ZCC, click > .
Configuring the Patch Tracker Dashlet
-
In the Patch Tracker Dashlet, click Configuration, and then click .
-
In Select Patches, select the required patches, and then click .
-
Specify a name for the dashlet and change the tracker icon, if required.
-
Vertica is required to retrieve the trending data. Hence, the Trend Chart fields are enabled only when Vertica is configured
In the Trend Chart section, based on your requirements, using the following option, you can assess the patch trending status in your Management Zone:
-
Date Grouping: You can group the trend data based on Day, Week, Month, Quarter or Year.
The chart will not be display any data until the end of the first period of the date grouping.
Example: If you choose Year, then you will not see any Trend Chart data for a year. Hence, while creating a new tracker, ensure that you set the Date Grouping to Day so that you see the data immediately. You can modify the filter at a later time, if you want.
-
Date Range: After selecting the Date Grouping filter, this option enables you to select the date range for the selected date grouping.
NOTE:Vertica is required to retrieve the trending data. The Trend Chart fields will be enabled only when Vertica is configured. For more information, see Vertica Database Reference.
-
-
Click Apply.
-
To save the dashlet, click the hamburger menu, and then select Save As.
After configuring the Patch Tracker dashlet, following information is displayed:
Patch Status: The Patch Status section provides current known status about the number of patched and unpatched devices that are grouped by platforms. Hover over each of the graph elements to know the number of patched and unpatched devices.
The number displayed in the Patch Status section represents the number of unpatched devices in the zone. The Patch Status graph is grouped based on platforms. This also displays the number of devices that are not patched in the Management Zone.
The Patch Status also displays an arrow that indicates the current unpatched device trend in the Management Zone. The following table describes the various scenarios and the associated status arrow:
-
 The green arrow pointing downwards represents the number of unpatched devices at the current point in time is less than the number of devices at the start of the date grouping period (Day, Week, Month, Quarter, or Year).
 -
 The red arrow pointing upwards represents the number of unpatched devices at the current point in time is more than the number of devices at the start of the date grouping period (Day, Week, Month, Quarter, or Year).
 -
 The two-sided arrow represents the number of unpatched devices at the current point in time is same as the number of devices at the start of the date grouping period (Day, Week, Month, Quarter, or Year).
Unpatched Device Trend: The trend chart displays the current and historical data of selected patches based on the selected date grouping and date range. By analyzing this section, you can check the patch trend in your zone and also take necessary actions, such as Deploy Remediation, to make your zone more secure. The trend data is displayed based on the server time.
NOTE:If a new device is added to the zone, then the trend data for the newly added device will be displayed only after the data is retrieved from Vertica. By default, the data from Vertica will be retrieved after 12 PM (Server Time).
For example, if the Date Grouping is Day and the Date Range is 1 Month, then the Unpatched Device Trend chart displays the trend for the last 30 days with each day represented as a point in the chart.
NOTE:The Unpatched Device Trend chart is displayed only when Vertica is configured and enabled. For more information, see the Vertica Database Reference in the documentation site.
Filtering the Dashlet Based on requirements, you can narrow-down the data displayed in the dashlet by using the Filter tab. Following are the available filter options:
-
Device Folders: In this filter, you can select the required device folders.Select to include folders within the selected folders.
-
Device Groups: In this filter, you can select the required device groups.
-
Device Type: In this filter, you can select the required type of device. The available options are Servers, Workstations and Mobile Devices.
-
Platform: In this filter, you can select the required platform. The available options are Windows, Linux and Mac.
-
Vulnerability Status: In this filter, you can select the vulnerability status of the device. The available options are Vulnerable or Not Vulnerable.
Execute actions from the Device Details panel
The Device Details panel displays the devices that meet the criteria that you defined in the dashlet filter panel. You can also filter the list by searching for a device name or a portion of the name in the search panel.
Following are the information displayed in the Device Details panel:
|
Field |
Description |
|---|---|
|
Device |
Displays name of the device. |
|
Status |
Displays the vulnerability status of the device. |
|
Last Vulnerability Scan |
Displays the date and time at which the Vulnerability Scan was performed on the device. |
|
Operating System |
Displays operating system on which the device is operating. |
|
Device Folder |
Displays the folder path in which the device is located. |
|
Remaining Vulnerabilities |
Displays the number of vulnerabilities that should be applied on the device to make the device less vulnerable. |
For information about other actions and options you have in the Device Details panel, see the following table:
Table 4-1 Device Details Panel
|
Task |
Description |
|---|---|
|
Deploy Remediation |
Deploys all patches required to remediate the vulnerability on the selected devices. Any required patches that have not already been downloaded (cached) to your zone will be automatically downloaded. For more information, see Deploying Patches Manually. |
|
Scan Now |
This action initiates a patch scan on the selected devices in order to ensure that you have the latest vulnerability status for the devices. |
|
Search |
The Search operates on the Device, Operating System, and Device Folder fields to allow you to filter the list based on the data in those fields. |
NOTE:For information about the other Security dashlets, see the Determine Vulnerabilities and Deploy Remediations section in the CVE Reference.
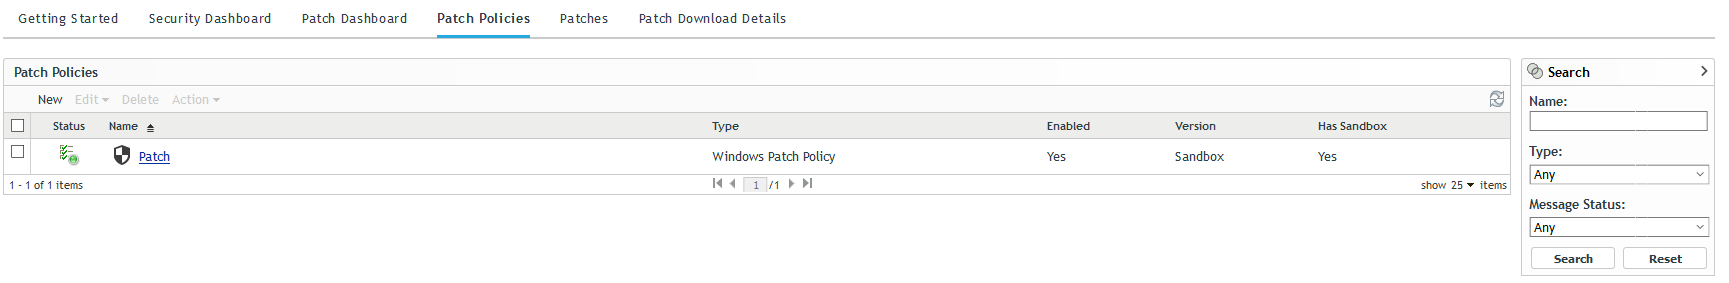
4.1.2 Viewing Patch Policies
You view, create, modify, and delete patch policies from the Patch Policies page. For detailed information about creating and managing patch policies, see Creating and Publishing Patch Policies.
To view patch policies, navigate to > .
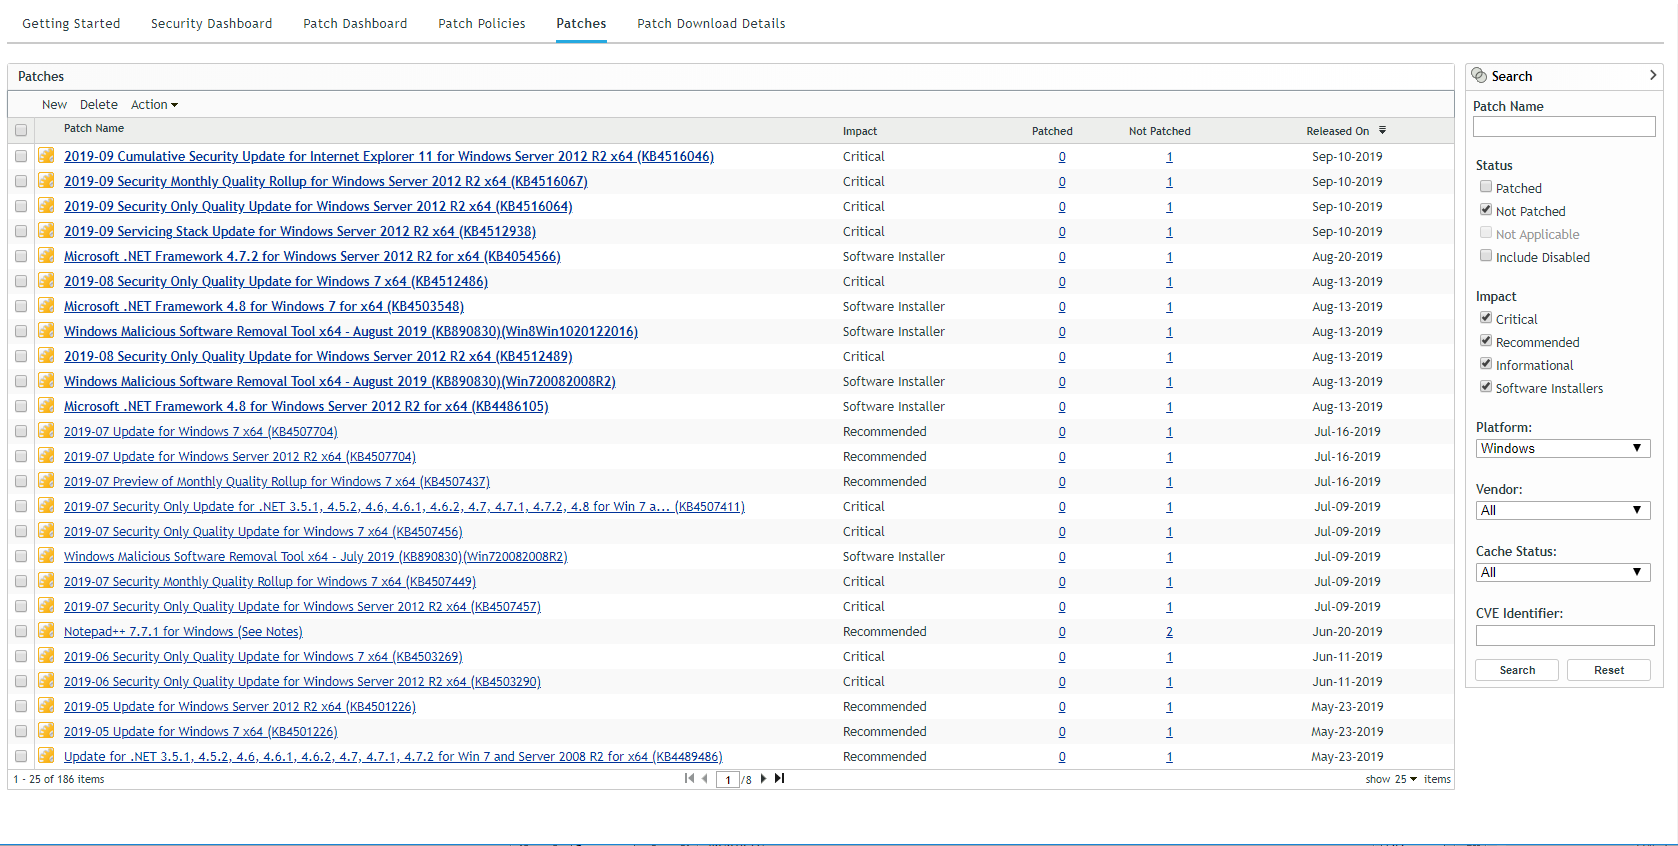
4.1.3 Viewing Zone Patches
To view the patches that are discovered in the zone from the DAU tasks, click in the navigation menu, and select the page.
The Patches page displays a complete list of all known patches reported by various software vendors. After they are reported and analyzed, the patches are registered for distribution to your ZENworks Server through the ZENworks Patch Subscription Network. The ZENworks Agent should be installed on each device to check for known patches. A patch bundle called Vulnerability Detection is then assigned to run on each device on a daily basis to scan for known patches. This task returns the results that are displayed on the Patches page. The results are presented in a table of patch status. The total number of patches is displayed below the table in the bottom left corner.
NOTE:The Patches page downloads and displays patches only for the operating systems that are running on your managed devices. This process prevents wastage of bandwidth and disk space, which would be required to store thousands of unneeded patches in the ZENworks Primary Server database. If you connect a device running a previously undetected operating system, you must initiate replication again so that the Patch Management Server downloads patches for that operating system.