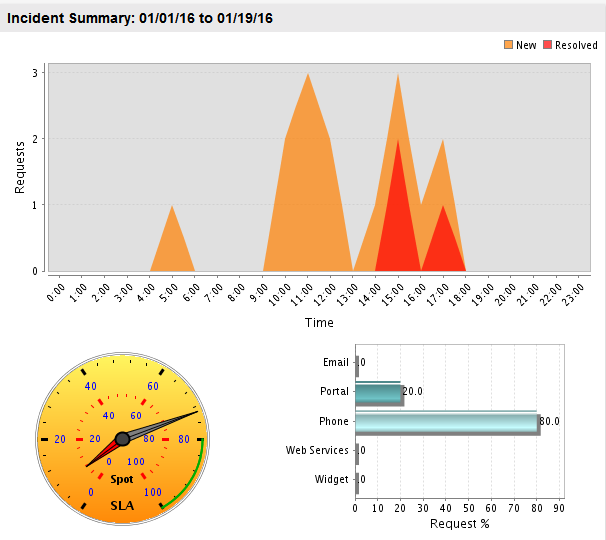
2.10 Reports

Online reporting provides Supervisors with a graphical snapshot of the overall performance of the Service Desk and its Users. The real-time Reports Module delivers easy access, and on-demand visual feedback that can be exported to Excel and PDF format.
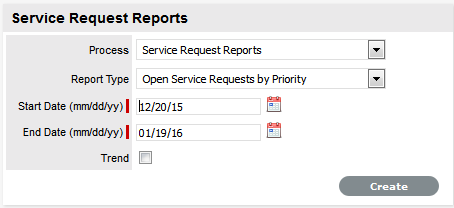
2.10.1 Create a Report
-
Select Reports> Report Type (e.g. Incident) sub-menu option
-
Select a Process, if relevant
-
Use the drop-down list to select the report required
-
Enter the date range, if applicable
The default Start Date is the last day of the previous month.
-
Refine parameters, if required
-
Click Create to generate the report.
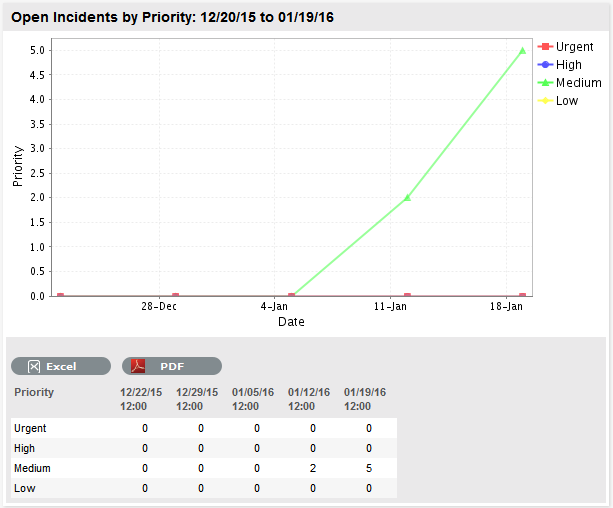
NOTE:The results are displayed as a chart and as a text table. They both can be exported as an Excel spreadsheet or as a PDF document.
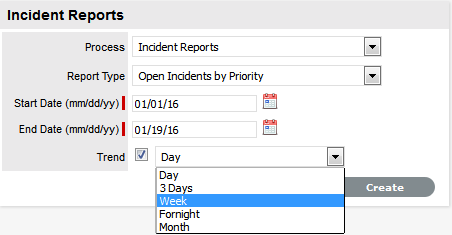
2.10.2 Trend Reports
A Trend Report allows data to be compared over time to monitor patterns. This type of report is only available for Incident, Problem, Service and Change Requests.
To create a Trend report:
-
Select Reports> Report Type (e.g. Incident) sub-menu option
-
Use the drop-down list to select the required report
-
Select the Trend checkbox
-
If the trend data is available for the selected report, a drop-down field appears. Select a period for the data:
Date Ranges for Trend reports:
Day
Up to 14 days.
3 Days
Up to 30 days.
Week
Up to at least 10 weeks.
Fortnight
Up to at least 10 weeks.
Month
Up to at least 12 months.
-
For Start Date, enter the start date or click on the calendar icon to define it within the calendar
-
Enter the End Date or select it from the calendar
-
Click Create.
2.10.12 Report Builder
The internal system report builder is designed as a mid-range report writing tool and does not replace report writing tools. It is intended to provide Users with the capability to build simple custom reports without requiring in-depth knowledge of the database schema.
Reports can be built across:
-
All request types
-
Teams and Technicians
-
Items
-
Organizational Units and Customers
-
Knowledge Base Articles
Service level management including SLAs, OLAs and UCs.
Working with the Report Builder, Users visually construct a query that can be run against the database through the relevant Reports sub-menu tabs. Within the query the User defines the various components of a query:
From - the objects forming the basis of the query for the report (The User selects the table or tables to query.)
Select - the fields of the relevant objects to be used for the report and if appropriate, how this information is to be expressed or manipulated based on functions for performing calculations (A statement that is used to select data from a database.)
Where - applies conditions to the data for inclusion in the report (Filters records to be used in the report. Extracts records that meet specific criteria)
Having - a special type of 'where' expression that applies to calculated fields rather than individual fields
Grouped - how this information is collated for presentation. (The User defines how a single value is calculated from multiple values in a column e.g., average, count, sum.)
The various elements of a report definition are detailed in the following table:
|
Report Builder |
Description |
|---|---|
|
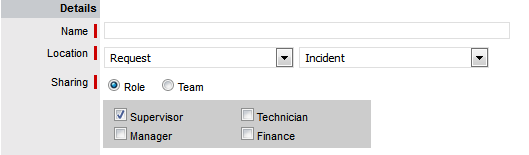
Details |
|
|
Name |
Enter a name that represents the data being presented by the report. |
|
Location |
Define the report list where the report will be stored within the Reports tab for generation. For example, if Incident is selected, the custom report will be found in the Incident Request Reports within the Reports>Requests>Process screen. Within this screen it is displayed with an * and can be generated, edited and duplicated. |
|
Sharing |
Select the Users who can access the report. Role : Tick the User Role groups for the custom report to be included within these Users Reports tab . Team: Select Team if the report is to be shared across members of a defined Team. |
|
From |
|
|
Entities |
The content of the Available Entities field initially displays a Base Entity list. Upon moving one selection to the Selected Entities field, the Available Entities list is filtered to displays entities directly related to the entry added to the Selected Entity field. For example when building a report against Incidents, assign the Incident Entity first, and the Available Entity list will show data fields related to Incidents only, such as Request Team, Request Priority or Request Classification, etc. |
|
Select |
|
|
Field |
Database options displayed here are derived from the Selected Entities Field. Within the first drop down list, select the database table to be used, and within the second drop down list select the column of information that is to be used for the report. |
|
Function |
If the information selected in the second drop down list of the Select field can be presented based on an applied condition, the Function field is displayed. For example, the Entity Request Priority can be expressed using a count, average, maximum, minimum or total. Define the condition to be applied to the Selected field and click |
|
Display Name |
Enter the Name for the field, as it is to be displayed in the report. |
|
Where |
|
|
Runtime Parameter |
For the details of a parameter are to be defined at the point a report is generated, select the Runtime option. For example, Technician Name. |
|
Field |
Database options displayed here are derived from the Selected Entities Field. Within the first drop down list, select the database table to be used, and within the second drop down list select the column of information that is to be used for the report. |
|
Expression |
This field defines how the information contained in the database table is to be treated when included in the report. For information that has no function, simply select if the defined parameter is to be true or false, for including in the report. For example, Archived or Deleted - true or false. If the information selected in the second drop down list of the Where field can be presented differently based on an applied condition, the Comparison list is displayed. |
|
Having |
|
|
Field |
Drop down options displayed here are derived from the Selected objects that use a function. |
|
Expression |
Having clauses are used to specify thresholds in queries. For example, a report that only returns Org Unit names that have an average fix time greater than an hour. (SELECT AVERAGE(INCIDENT.FIX_TIME), ORG_UNIT_ID FROM INCIDENT WHERE DELETED != 1 HAVING AVERAGE(INCIDENT.FIX_TIME) > 60 GROUP BY ORG_UNIT_ID ORDER BY x0_0_ |
|
Grouped By |
|
|
Field |
The displayed list is derived from the options included in the Select list for data that do not use functions. This defines the clauses used to group the data. |
|
Order By |
|
|
Fields |
Select one or more expressions for sorting the data. |
|
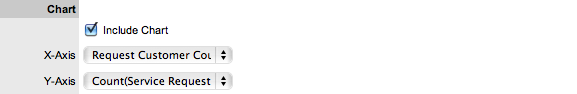
Chart |
|
|
Include Chart |
This option is available if the data selected for the report can be displayed in chart format. |
|
X-Axis |
Drawn from the Grouped By field. |
|
y-Axis |
Drawn from the Having field. |
|
Query |
|
|
Select, From, Where |
Displays the query built by what has been defined in the Select, From, Where and Group By fields |
Reports can be built that extend those included in the product to meet specific organizational needs, and a clear report objective is required before commencing the process of building a report.
Example 1: Service Requests by Country
For example the service organization may want to report on which countries are generating the bulk of the Service Requests logged with the service desk. To build the report, the following steps are required:
-
Select the Reports > Builder tab
-
Enter the Details
This report will be named Total Service Requests by Country, and will be located under Requests > Service Request within the reports, shared with other Supervisors.
-
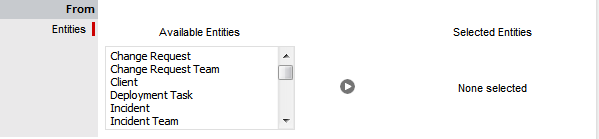
In the From field, define which database tables/entities are required for the report
In order to build the report a base object is needed which in this case is the Service Request entity. The Request Customer Country entity is also required, but to access this, the Request Customer entity must be added first.
-
Based on the entities added within the From field, complete the Select and, if relevant, Function information
A count of requests by country is desired, so for the Select Field, select Service Request and ID, and set the objective (Function) is to count the request ID’s. Click the
 button to add this selection.
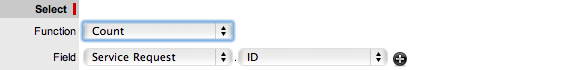
This will provide the counts but in addition to this we need to see the names of the respective countries in the result, so once again within the Select Field, select Request Customer Country and then Name. Click the
button to add this selection.
-
Within the Where field, define how the information is to be treated for inclusion in the report
This report should exclude records that are archived or deleted, so select those fields of the service request, setting the expression to False. Click the
button to add terms.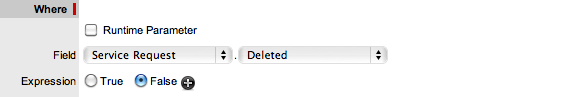
-
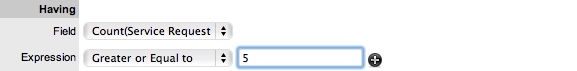
Further refine the data requirements for inclusion in the report by completing the Having fields
Since the Select option uses a Function, the Having selection is available. As the report is looking for high volume countries, it is possible to exclude countries with less than 5 results using the Greater or Equal to expression.
-
Within the Grouped By field, set how the data is to be presented
The counts need to be collated by country, so add the Request Customer Country.Name option in the Group By field.

-
Further refine how the data should be sorted for presentation using the Order By field
For this report the key metric is the count, so this report should be sorted by the count, in descending order with the highest values appearing at the top of the report.

-
If a chart is to be included in the report, set the Chart field
Inclusion of a chart showing the results can aid the presentation of result data, in this case the X-Axis will contain the country names, and the Y-Axis will represent the counts.
-
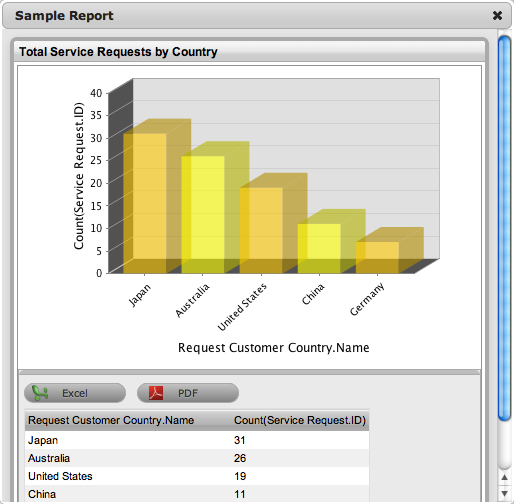
Click Test to generate a sample report or Save to record the report
The report definition is complete and a sample can be generated using the test button. Alternatively, it can now be saved, which will make it accessible in the Location specified when building the report.
-
Fine tune the report, if relevant, by adding Runtime Parameters
The sample report generated thus far is a good base but would benefit from some fine tuning, as it currently reports against all Service Requests ever logged. The desired data is more than likely to be measured over a specified time frame. This can be achieved by adding some runtime parameters to the Where clause for the Service Request entity.
Working within the saved report, click Edit with the report selected and the report builder is opened, with the current definition in place.
Adding the above fields will allow start and end dates to be specified when the report is accessed.
-
Click Save
The report generation page now includes the newly added date fields.
-
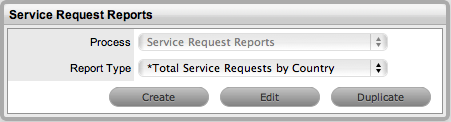
Access the report in the saved location.
Navigate to the Service Request filter of the Reports>Requests screen to access the Total Service Requests by Country report. The custom report will be prefixed with an asterisk for identification. It can be accessed and executed by the owner and other Supervisors per the defined sharing options.
Example 2: Item Purchases by Item Category
For example the service organization may need to know what Items are purchased by Category within a specific timeframe. To build the report, the following steps are required:
-
Select the Reports > Builder tab
-
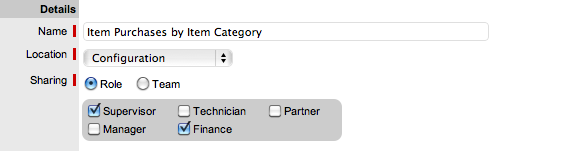
Enter the Details
This report will be named ‘Item Purchases by Item Category’, and it will be saved under Reports > Configuration and shared with other Supervisor and Finance Users.
-
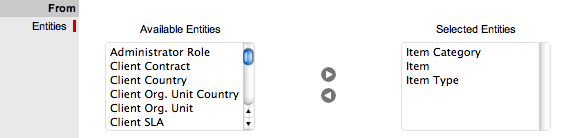
In the From field, define which database tables/entities are required for the report
In order to build the report a base object is needed which in this case is the ‘Item’ entity. The Item Category is required, but to access it, the Item Type entity must be added first.
-
Based on the entities added within the From field, complete the Select and, if relevant, Function information
A count by Item Category is desired, so for the Select option, the objective is to count the Item ID’s. Click the
button to add this selection.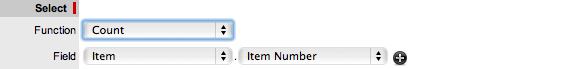
This will provide the counts but in addition to this we need to see the names of the Categories in the result, ideally along with the Category ID’s for grouping. Click the
button to add this selection.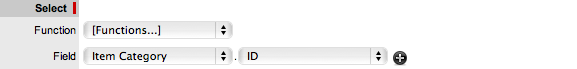

-
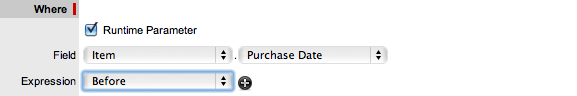
Within the Where field, define how the information is to be treated for inclusion in the report
This report should exclude records that are archived or deleted, so select those fields of the service request, setting the expression to False. Click the
button to add terms.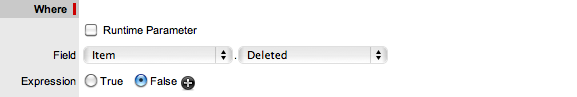
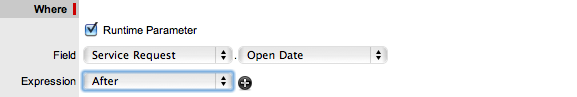
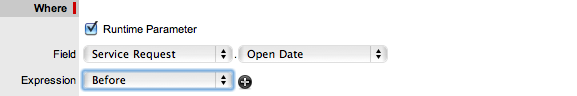
This report will be run on a monthly basis, so it requires a date range to be defined at runtime by the user running the report. Click the
button to add the Before and After as Runtime Parameters.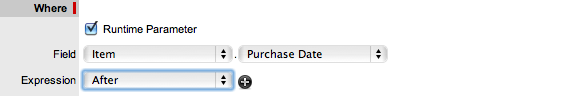
(This report will not contain a Having clause as all the results are to be shown.)
-
Within the Grouped By field, set how the data is to be presented
The counts need to be collated by Item Category, so in the Group By field ‘Item Category.ID’ should be added. Click the
button to add this selection.
-
Further refine how the data should be sorted for presentation using the Order By field
This report is going to be ordered by category name to expedite any required checks that may be needed later. Click the
button to add this selection.
-
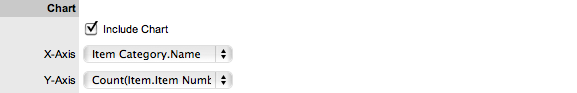
If a chart is to be included in the report, set the Chart field
Inclusion of a chart showing the results can aid the presentation of result data, in this case the X-Axis will contain the Category names, and the Y-Axis will represent the counts.
-
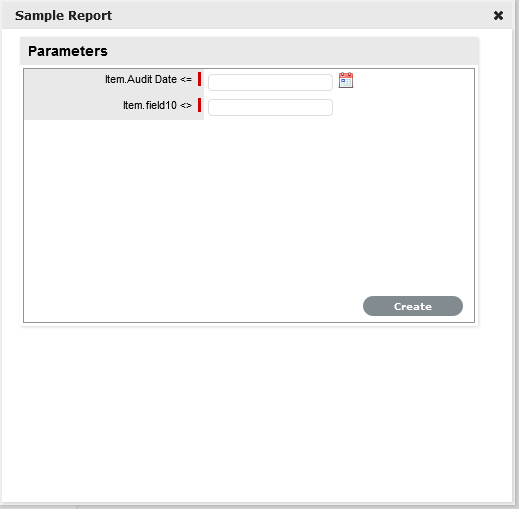
Click Test to generate a sample report or Save to record the report
The report definition is complete and it can now be saved (which makes it accessible in the specified location), alternatively a sample can be generated using the Test button, which prompts for the required fields.
-
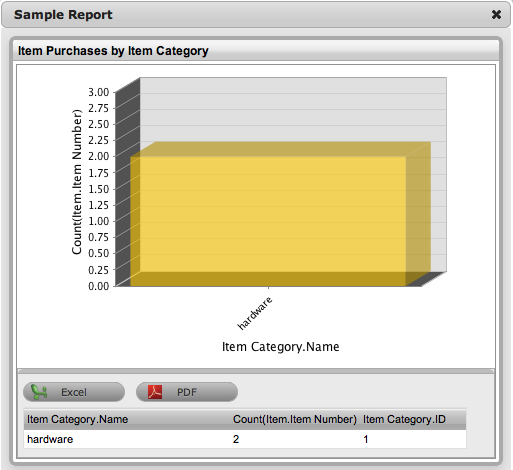
Access the report in the saved location.
Navigate to the Reports>Configuration screen to access the Item Purchases by Item Category report.
The custom report will be prefixed with an asterisk for identification. It can be accessed and executed by the owner and other Supervisor or Finance Users per the defined sharing options.