2.2 About the Portability Suite Client User Interface
The Portability Suite Client window consists of the following elements:
-
Menu bar: Reflects the current view and provides command groups for accessing program features and operations.
-
Toolbar: Reflects the current view and provides visual shortcuts to program features and operations.
-
Current view: The main work area of the interface; lists either machines (when in Servers view mode), or jobs (when in Jobs view mode).
-
Panes: Vertically aligned at the left side of the window, panes facilitate the selection of the current view (View pane) or a conversion job (Tasks pane). A Details pane reflects the current view and provides summary information about an item selected in the current view.
-
Status bar: At the bottom of the Portability Suite Client window, the status bar displays the Portability Suite Server that the client is currently connected to, the Portability Suite Network you are currently working with, the name and role of the current user logged in, and the status of the Automatic Network Discovery feature.
For additional information, see the following sections.
2.2.1 Servers View
The Servers view is the main visual interface to your discovered source workloads and targets. Its main area consists of two split panes that you can customize to suit your needs.
Figure 2-1 Portability Suite Client‘s Servers View

The hierarchical display of items in the Servers view reflects the organization of items on their respective platforms; for example: VMs are shown nested beneath their VM hosts, PlateSpin® Flexible Images are beneath their image servers, and Solaris zones (regarded as VMs) are beneath their respective Solaris zone servers.
In addition, the bar enables you to group machines by affiliation to a domain or to a vCenter Server (for VMware ESX server systems). See Organizing the Servers View.
NOTE:The Servers view hierarchy does not reflect advanced VM resource management hierarchies and structures, such as membership in resource pools or affiliation with ESX Distributed Resource Scheduler (DRS) clusters. You can view such information in an item’s properties. See Viewing the Properties of Source Workloads and Targets.
Organizing the Servers View
You can filter source workloads and targets based on operating system, domain, name, and type by using the and drop-down menus. You can use the drop-down menu to group the items in the Servers view by:
-
Domain affiliation
-
Hostname
-
Affiliation to a VMware vCenter* Server
To further control the scope of items shown in either pane of the view, you can also use the drop-down menu to filter machines by workload type; for example, Windows NT 4, Windows 2000, Red Hat Linux, and so on, as shown in the figure below:
Figure 2-2 Servers View Options for Sorting Items by Type

Viewing the Properties of Source Workloads and Targets
In the Servers view, you can access the essential properties of your discovered source workloads and targets by right-clicking an item and selecting .
For each machine, the system provides information about the selected system’s:
-
Hardware, operating system, and network profile
-
Volumes, partitions, and disk usage
-
Programs and services
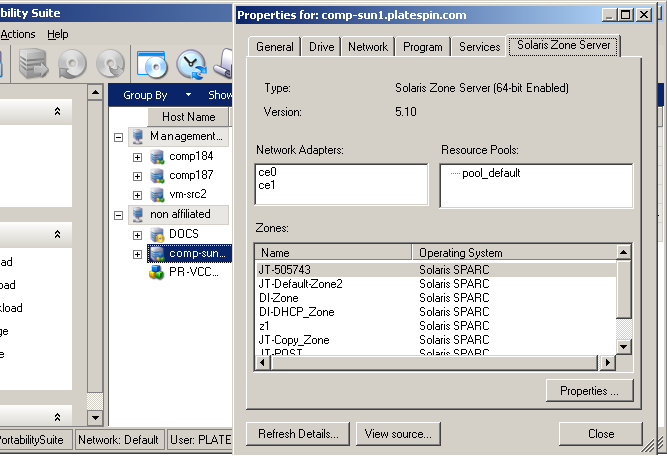
A virtual machine’s properties provide information related to the machine’s environment on its corresponding virtualization platform, including information about the host, and the amount of allocated memory and processing power.
The properties for virtual machine hosts provide information specific to the selected system. For example, you can view what virtual machines are running on a selected VMware ESX server, what virtual network adapters are in use, and what resource pools are configured on them.
VMware ESX servers that are assigned to a Distributed Resource Scheduler (DRS) cluster provide information about the name of the cluster and the DRS automation level (full, manual, or partially automated).
The properties for VMware ESX servers that are part of VMware vCenter platforms also indicate this.
The following figure shows the properties of a discovered Solaris zone server.
Figure 2-3 Solaris Zone Server-Specific Information in the System’s Properties
List of Machine-Specific Icons in the Servers View
Discovered source workloads and targets are associated with unique icons to help identify the type of workload or workload host.
Table 2-1 Machine-Specific Icons in the Servers View
2.2.2 Jobs View
The Jobs view displays all discovery, conversion, and image capture jobs run by the Portability Suite Server. Jobs can be filtered based on their current state.
Figure 2-4 Portability Suite Client‘s Jobs View
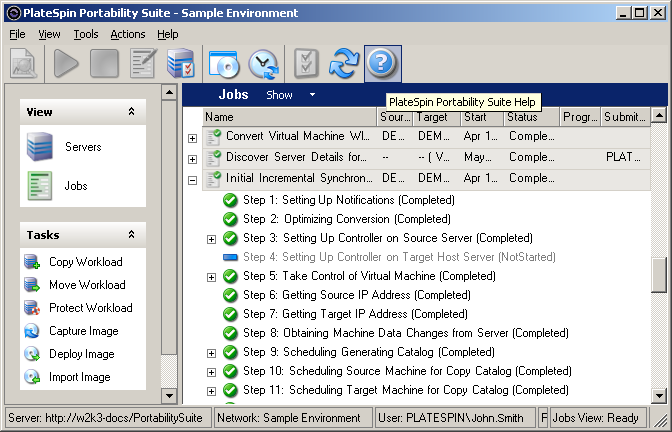
You can use the drop-down menu to filter the Jobs view to display specific sets of jobs: Recent Jobs Only (past 24 hours), Conversion Jobs Only, Failed, Running, Completed, and/or Saved jobs. When a job is selected from the list, the lower left pane of the screen displays a summary of the job details.
2.2.3 Tasks Pane
The Tasks pane of the Portability Suite Client window contains most essential conversion actions. Clicking a task opens the Action window, which you can use to select the conversion source, target, and setup method. See Section 2.7.1, Selecting a Conversion Job Setup Method.
2.2.4 Status Bar
The status bar of the Portability Suite Client window displays information about:
-
The Portability Suite Server that you are currently connected to.
-
The Portability Suite Network that you are currently working with.
-
The User that you are logged in as, and the Portability Suite role assigned to your user account.
-
The status of the Automatic Network Discovery feature.
Figure 2-5 Status Bar of the Portability Suite Client Window

Double-clicking any of the first three status items opens the Portability Suite Server Settings window. See Connecting to a Portability Suite Server.
Double-clicking the Network Discovery status item turns Automatic Windows Network Discovery on or off. See Discovering and Preparing a Windows VM for a Server Sync Job.