2.2 Viewing Search Results
Searches return a set of events. When results are sorted by relevance, only the top 50,000 events can be viewed. When results are sorted by time, all the events in the system are displayed.
Occasionally, the search engine might index events faster than they are inserted into the data directory. If you run a search that returns events that were not added in the data directory, you get a message indicating that some events match the search query, but they are not found in the data directory. If you run the search again later, the events are added to the data directory and the search is shown as successful.
NOTE:If time is not synchronized across your server, client, and event sources, you might get unexpected results from your search. This is especially a problem if searches are performed on time durations such as Custom,, and where display results are based on the time zone of the machine on which the search is performed.
The information in each event is grouped into the following categories:
|
Category |
Icon |
Description |
|---|---|---|
|
General |
No icon |
Generic information about the event, such as severity, date, time, product name, and taxonomy. |
|
Initiator |
|
The source that caused the event to occur. The source can be a device, network port, etc. |
|
Target |
|
The object that is affected by the event. The object can be a file, database table, directory object, etc. |
|
Observer |
|
The service that observed the event activity. |
|
Reporter |
|
The service that reported the event activity. |
|
Tags |
No icon |
Tags that the events are being tagged with. |
|
Customer value |
No icon |
Fields set by the customer. |
|
Retention period |
No icon |
Retention period of the event. |


The initiator, target, and observer can be hosts, services, and accounts. In some cases, the initiator, target, and observer can be all the same, such as a user modifying this or her own account. In other cases, the initiator, target, and observer can be different, such as an intrusion detection system detecting a network attack. If an event field has no data, it is not displayed in the results.
Event fields are grouped according to the following categories:
|
Group |
Icon |
Description |
|---|---|---|
|
Host |
|
The initiator or target host information. For example, initiator host IP, target hostname, or target host ID. |
|
User |
|
The initiator or target user information. For example, the initiator username, initiator user department, target user ID, or target username. |
|
Service |
|
The initiator or target service information. For example, the target service name, target service component, or initiator service name. |
|
Domain |
|
Domain information of both the host and user. For example, the target host domain and initiator username. |
|
IPCountry |
|
The country information of the initiator and target trust. For example, the target host country. |
|
Target trust |
|
The target trust and target domain information of the event that was affected. The name can be a group, role, profile, etc. |
|
Target data |
|
The target data name and data container information. The data name is the name of the data object, such as a database table, directory object, or file that was affected by the event. The data container is the full path for data object. |
|
Tenant name |
|
The name of the tenant that owns the event data, applied to all the events in the inbound stream from a given Collector. The tenant name can be the name of the customer, division, department, etc. |
|
Vulnerability |
|
A flag that indicates whether Exploit Detection has matched this attack against known vulnerabilities in the target. |


Each event type is represented by a specific icon. The following table lists the icons that represent the various types of events:
|
Icon |
Type of Event |
|---|---|
|
|
Audit event |
|
|
Performance event |
|
|
Anomaly event |
|
|
Correlation event |
|
|
Unparsed event |


You can view the search results in the summary view and in the detailed view. When you mouse over an event field, the information about the field is displayed.
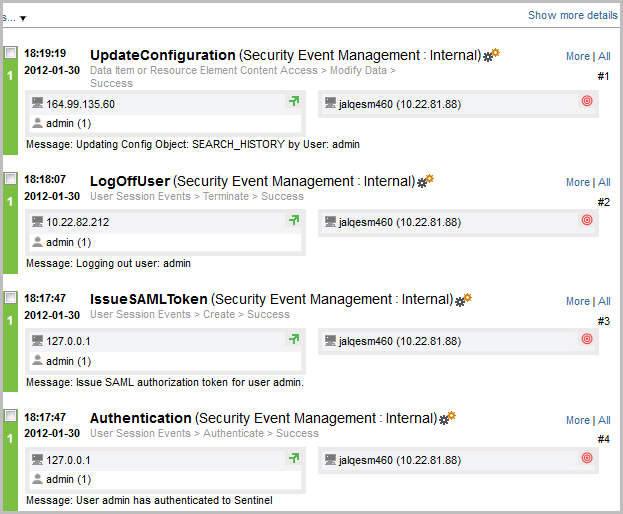
2.2.1 Summary View
The Summary view of the search results displays the basic information about the event. The basic information includes severity, date, time, product name, taxonomy, and observer category for the event.
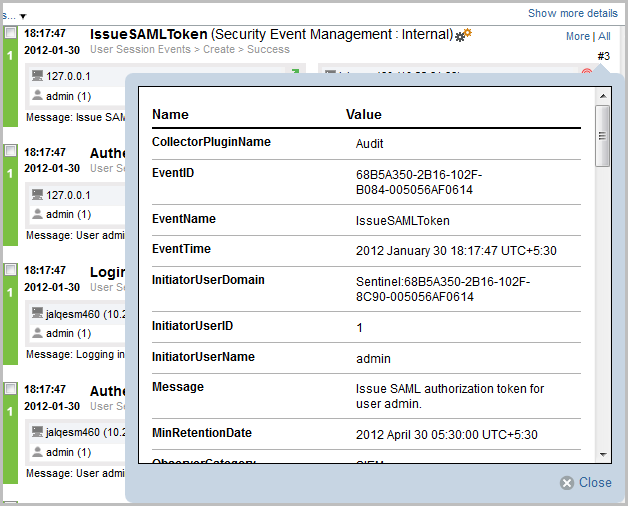
2.2.2 Detailed View
-
To view the report details, click the link at the top right corner of the search results.
This displays details such as host/user domain information, IPCountry information, extended target fields like TargetTrust and TargetData, Observer and Reporter fields, customer set variables, default data retention duration information for any individual event, and the tags set for the event.
-
To view all the details of an event, click the link.
-
To view details about all events, click the link at the top of the search results page.
You can expand or collapse the details for all events on a page by using the or link.
-
(Optional) Click the link to open a new tab with event source hierarchy and event source fields populated, based on the information received from the event.
The link is available only for users in the administrator role.
If the search result is a system or an internal event, the link does not appear.
To verify and download the raw data files, see
Verifying and Downloading Raw Data Files
in the NetIQ Sentinel 7.0.1 Administration Guide.