16.8 Using DS Trace
Designer provides DS Trace so you can monitor DirXML events in your Identity Manager environment. DirXML events constitute those events accessible by using the “dirXML” and “dirXML Drivers” switches in eDirectory’s DS Trace service.
Designer uses LDAP to obtain this information from the Identity Vault. By default, it uses the default LDAP ports (389 or 636) to establish a connection. If your LDAP service runs on non-standard ports, make sure you specify the correct ports.
DS Trace lets you view both live DS Trace logs, and create and view stored DS Trace log files.
NOTE:The DS Trace view is not the same as the Trace view, which provides information about Designer functionality. For information on the Trace view, see Trace.
DS Trace includes the following icons:

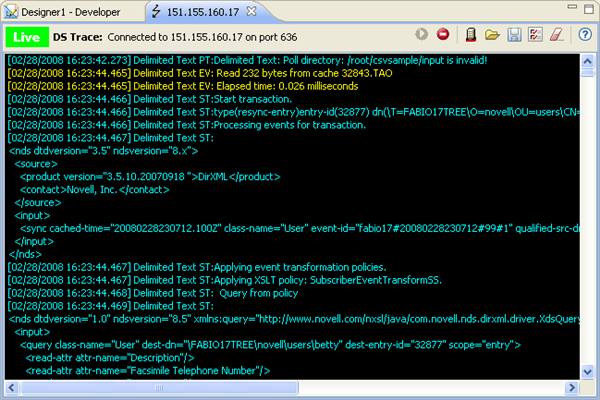
16.8.1 Viewing DS Trace Live
You can view a live DS Trace for any Identity Vault in your Identity Manager environment.
NOTE:Designer provides live DS Trace preferences that let you specify how many entries to keep in the log and whether or not to auto-scroll the log so you can always see the most current entries. You can edit these preferences in > , then select > > from the left-side navigation.
If the Identity Vault is in your current Designer Project:
-
In the Object view or the Modeler, select an Identity Vault object, then select > .
Alternatively, you can right-click the Identity Vault object, then select > .
-
Review the live DS Trace session as needed.
By default, the DS Trace session is running. You can stop, resume, clear, and save the current trace to a file by using the icons in the DS Trace view toolbar.
If the Identity Vault is not in your current Designer project:
-
From the main Designer toolbar, select > .
-
In the DS Trace view, click the icon.
-
In the Login Credentials dialog box, specify the directory Host name (or IP address), username, and password necessary to connect to the appropriate Identity Vault, then click .
Select if you need to use SSL to connect to the Identity Vault server.
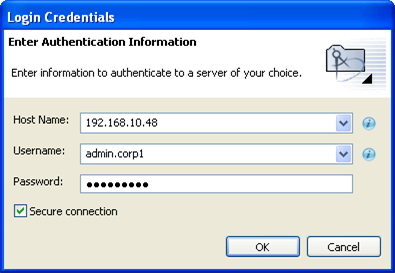
You can open a DS Trace session to a different Identity Vault server at any time by clicking and providing the appropriate authentication credentials.
-
Review the live DS Trace session as needed.
By default, the DS Trace session is running. You can stop, resume, and save the current trace to a file by using the icons in the DS Trace view toolbar.
16.8.2 Creating a DS Trace Log File
DS Trace lets you create log files of DS Trace entries so you can review them off-line. To create a DS Trace log file:
-
From the live DS Trace view, select the icon
 .
.
-
Specify a name and location for the log file, then click .
DS Trace saves the log file as a rich text file (.rtf) so it can maintain the color coding used in the live DS Trace view. You can view the log file with any editor that supports the .rtf file format.
16.8.3 Viewing a DS Trace Log File
The DS Trace view is an editor that enables you to view DS Trace log files.
Figure 16-4 The DS Trace View
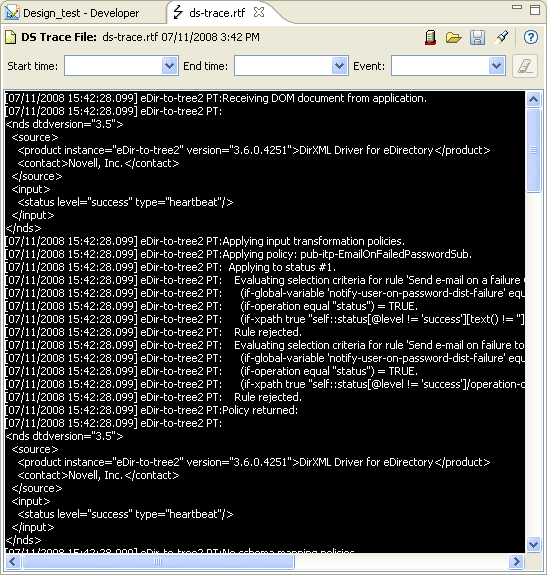
To view DS Trace log files:
-
Click > .
-
Select the icon, then browse to and select the DS Trace log you want to open.
-
Review the DS Trace log file as needed.
-
Use the , , and dropdown lists to filter the trace file. This helps you narrow the displayed trace file data so you can more easily locate specific information.
-
To clear an existing filter, click the button
 .
.
-
Select the icon (in the DS Trace icon bar) to open a Find/Replace dialog box that lets you search for a specific string in the DS Trace log file.
-
NOTE:The Eclipse text editor does not support color, so when you view a DS Trace file in Designer it displays in black and white. However, since Designer saves the DS Trace log file in standard Rich Text Format (.rtf), any external text editor that supports color will display the log file in color, as seen in the live DS Trace view.