12.5 Configuration Tab
Use this page to establish configurations and set preferences for an extensive set of File Dynamics tools.
12.5.1 General Preferences
This page lets you view and set Engine configuration settings.
General
The tab includes proxy and management access settings. Each of the fields is described below.
Figure 12-53 The General Tab of the Configuration Page
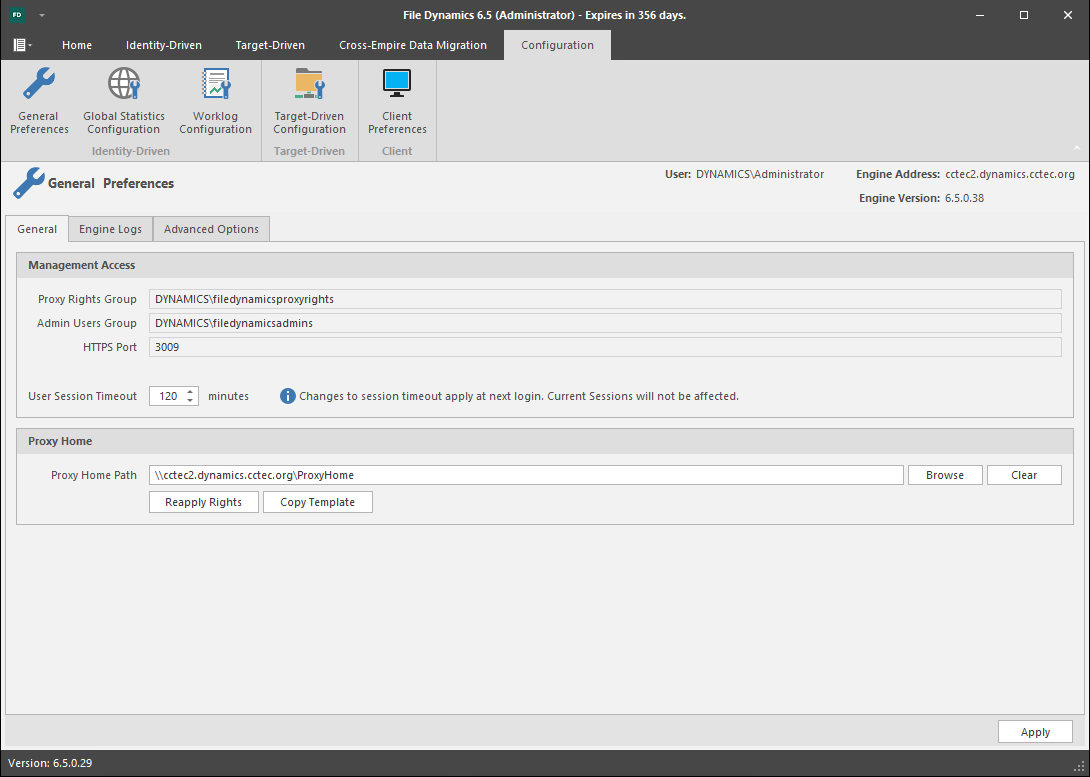
Proxy Rights Group: Displays the Proxy Rights Group that you established when you installed File Dynamics.
Admin Users Group: Displays the Admin Users Group that you established during the installation of File Dynamics.
HTTPS Port: Displays the HTTPS port that you chose when you installed File Dynamics.
HTTP Port: If you chose to use an HTTP port during the installation of File Dynamics, the HTTP port is displayed here.
User Session Timeout: Indicates the number of minutes the Admin Client can be left dormant before you need to reauthenticate.
Proxy Home Path: This path was established during the installation of the Admin Client. If you need to, you can change the path by using the button.
Reapply Rights: Clicking this button reestablishes the ability of the proxy rights group to manage the Proxy home share. It also reestablishes the group Everyone with the Read right so that its members can read contents. The Read right is needed in case the Proxy home share is being used as the managed path attribute while storage is being moved.
Copy Template: Clicking this button recopies files located in C:ProgramData\Micro Focus\File Dynamics\Engine\data\ProxyHome to the location specified by the share. If the proxy home is not located on the server hosting the Engine, this makes it so you can recopy the template files without having to do it manually.
Engine Logs
The Engine Logs tab includes settings specific to log files. Log files are accessible only from the server hosting the Engine at C:\ProgramData\Micro Focus\File Dynamics\Engine\log.
Each of the fields is described below.
Figure 12-54 The Engine Logs Tab of the Configuration Page
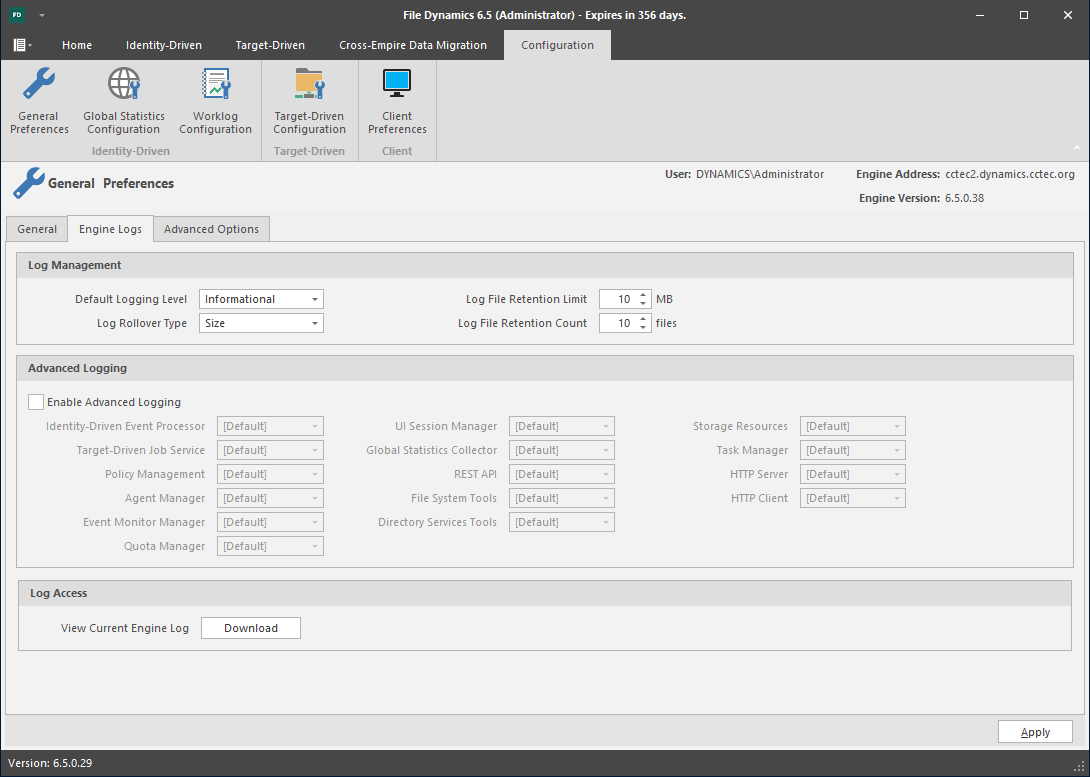
Default Logging Level: By default, the log records warning level details. You can change the log to record the level you want. Be aware that some settings, such as debug or verbose, record much more information and can potentially make the log file much larger.
Log File Retention Limit: This field appears only when you select from the field. You need to enter the size limit in MB for the log file before it creates a new file.
Log Rollover Type: You can choose whether to have log files roll over daily, hourly, when the log has reached a set size limit, or have no rollover setting. If you select , the same log file is opened each time you start the Engine, and log entries are appended to it.
NOTE:If you delete the log file while the Engine is not running, a new log file is created the next time you start the Engine.
Log File Retention Count: By default, File Dynamics retains the 10 most recent log files, according to the setting. For example, if the setting is set to the retained log files are from the last 10 days.
Enable Advanced Logging: Selecting this check box activates the region of the page. This region allows you to specify the output of the log file according to the setting you indicate in each of 13 categories.
Advanced Options
The tab lets you view or reconfigure the thread count settings allocated for the actions that File Dynamics performs.
Figure 12-55 The Advanced Options Tab of the Configuration Page
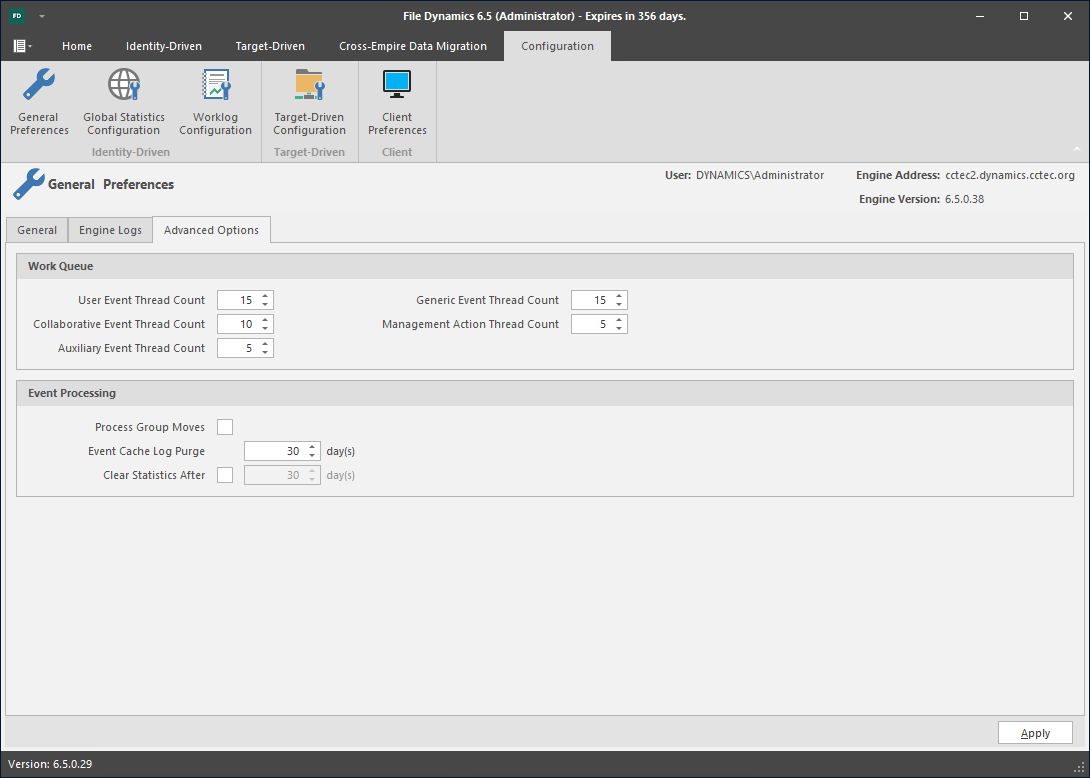
Work Queue: These settings are optimized for a normal File Dynamics workload.
Process Group Moves: Click this box to enable File Dynamics to move collaborative storage.
Event Cache Log Purge: By default, File Dynamics keeps the most recent 30 days of event entries in cache. You can adjust the setting in the field.
The event cache can be helpful in providing you a recent history of all of the events that were sent from the Event Monitor.
Clear statistics after: This option specifies how long statistics are kept for the graphs displayed on the Statistics page.
12.5.2 Global Statistics Configuration
The default configuration of the GSR Collector forces it to behave in a manner consistent with legacy versions of Storage Manager. However, it is not optimal for most deployments. The GSR Collector can be scoped by file system and directory service parameters.
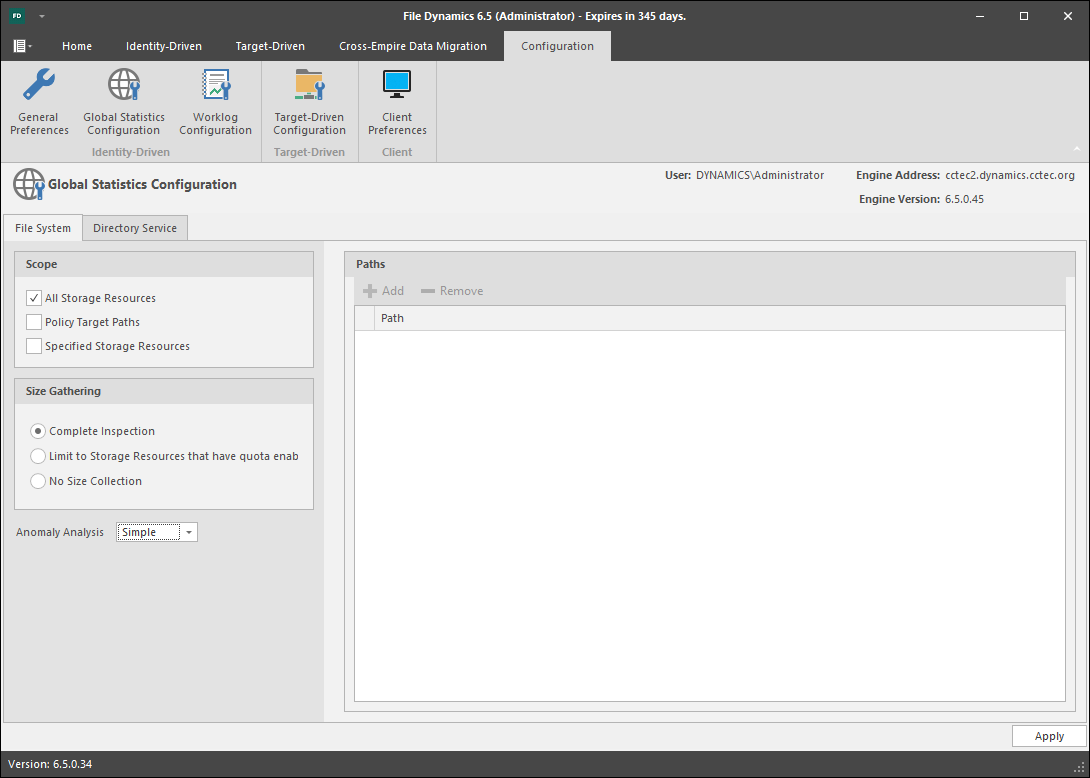
Figure 12-56 File System Configuration Settings for the GSR Collector
File System Tab
Scope: The file system scope provides the means for you to determine which shares should be scanned by the GSR Collector. The file system scopes are:
-
All Storage Resources: This is the default option and mutually exclusive of and . This will cause the GSR Collector to scan the root of all shares that appear in Storage Resources for size and anomaly data. This can take a significant amount of time to complete depending on the share type, contents, and the chosen option. In large environments, this is not the recommended configuration.
-
Policy Target Paths: This option can be checked separately or combined with for greater flexibility. This will cause the GSR Collector to only scan paths defined as policy target paths for size and anomaly data. After you have your storage managed by policy, use this option to limit the scope and provide meaningful size and anomaly analysis data for the storage resources that matter most.
-
Specified Storage Resources: This option can be checked separately or combined with for greater flexibility. This will cause the GSR Collector to only scan paths defined by you for size and anomaly data. When running the GSR Collector for the first time, this option serves as the best choice because it allows you to target specific paths and storage resources.
Size Gathering: The size gathering options allow you to control the method by which aggregate size data for global statistics and policy-based path redistribution is collected.
-
Complete Inspection: This is the default option. To collect size data, folders are checked for quota. If quota is determined to be supported by the hosting server and the folder has a quota, FSRM is queried to obtain the relevant data. In the case where the folder does not have a quota managed by FSRM or it simply has no quota at all, the folder is traversed to collect size data of all files.
-
Limit to Storage Resources that have quota enabled: If quota is determined to be supported by the hosting server and the folder has a quota, FSRM is queried to obtain the relevant data. The folder must have a quota set to eliminate brute force enumeration to collect size data.
-
No Size Collection: No size data collection is attempted.
Anomaly Analysis: The file system anomaly analysis provides the means for you to determine the level of anomaly analysis. The options are:
-
None: Anomaly analysis will not be performed.
-
Simple: This is the default option and sufficient for most purposes. The following anomalies are reported:
-
Attribute Value Missing: The respective path attribute (e.g. home folder) does not have a value.
-
Path Missing On Disk: The respective path attribute value cannot be found on disk.
-
Path Validation Issue: Attempting to retrieve or verify the existence of the respective path attribute value failed.
-
Name Mismatch: The respective leaf path value does not match the object’s name value.
-
Path Mismatch: The respective path attribute value does not match the last known managed path database entry.
-
DS Path Duplicate Value: Two or more objects have been detected that contain the same path for the respective path attribute.
-
DS Path Crosstalk Parent: The object’s respective path attribute has been detected as being the parent of another object’s path attribute.
-
DS Path Crosstalk Child: The object’s respective path attribute has been detected as being the subordinate of another object’s path attribute.
-
Orphan Path Candidate: The path is directly subordinate to a path at which other DS-associated paths have been found, but has not been detected as being associated with any DS object via a path attribute.
-
-
Full: Reports additional policy related anomalies.
-
Policy Not Found: The respective auxiliary policy attribute entry references an auxiliary policy that was not found in the database.
-
Policy Object Not Managed: Effective policy calculations indicate that a policy is effective for the respective object and path type, but the object is not known to be managed.
-
Policy Mismatch: The respective path is indicated as being managed in the database, but the policy under which it is currently managed does not match what effective policy calculation indicates it should be.
-
Policy Validation: An error occurred while attempting to calculate effective policy for the object and respective path type.
-
Directory Service Tab
Container Scope: The directory service container scope provides the means for you to determine which containers should be enumerated by the GSR Collector for Anomaly Analysis, Global Statistics, and History. The container scopes are:
-
All Containers: This is the default option and mutually exclusive of and . This will cause the GSR Collector to enumerate all object types specified by the Object Scope for size and anomaly data.
-
Policy Associated Objects: This option can be checked separately or combined with for greater flexibility. This will cause the GSR Collector to only enumerate and evaluate objects that are associated to policies. After you have your objects managed by policy, use this option to limit the scope and provide meaningful anomaly analysis data for the objects that matter most.
-
Specified Containers: This option can be checked separately or combined with for greater flexibility. This will cause the GSR Collector to only enumerate and evaluate objects defined by you for size and anomaly data. When running the GSR Collector for the first time, this option serves as the best choice because it allows you to target specific objects for analysis.
The containers specified in the container scope are searched recursively for object types configured in the Object Scope.
Object Scope: The directory service object scope provides the means for you to determine which object types and path types should be enumerated by the GSR Collector for Anomaly Analysis, Global Statistics, and History. The object scopes and path types are:
-
Users
-
Home Folder
-
Profile Path
-
Remote Desktop Services Home Folder
-
Remote Desktop Services Profile Path
-
Auxiliary (ccx-FSFAuxiliaryStorage)
-
-
Groups – Collaborative managed path (ccx-FSFManagedPath)
-
Containers – Collaborative managed path (ccx-FSFManagedPath)
GSR Collector Configuration Scenarios
All Storage Resources + Complete Inspection
This default configuration will cause the GSR Collector to enumerate all shares found in Storage Resources. During the enumeration, child folders at the root of shares are inspected for anomaly analysis and checked to determine if they have a quota applied to them via File Server Resource Manager (FSRM). If they have a quota, FSRM is queried to obtain it. In the case where a server hosting a share does not support quota (e.g. FSRM is not installed, the server is a NAS device) a brute force enumeration of the child directories is performed to collect size data for statistics and policy-based storage redistribution. Depending on the number of directories and their contents, this is a time consuming and resource intensive operation. While it ensures that all of the available shares are scanned, it is not the most efficient use of the GSR Collector.
All Storage Resources + Limited to Storage Resources that Have Quota Enabled
This configuration will cause the GSR Collector to enumerate all shares found in Storage Resources. During the enumeration, child folders at the root of shares are inspected for anomaly analysis and checked to determine if they have a quota applied to them via FSRM. If they have a quota, FSRM is queried to obtain it. This configuration is more efficient than Complete Inspection. However, if you have folders that do not have quota, there will be size data missing from Global Statistics and Policy-based Path Redistribution that would skew your results.
All Storage Resources + No Size Collection
This configuration will cause the GSR Collector to skip enumeration of all shares found in Storage Resources for size related data. If Global Statistics are not needed on a regular basis or you have a need for finer granularity in your historical data, this option may be best suited for your goals. However, if you choose this option, there will be no size data to drive Global Statistics and Policy-based Path Redistribution.
12.5.3 Work Log Configuration
This page lets you establish the Work Log Database Settings in the Admin Client. For detailed procedures, see Section 11.3, Establishing the Work Log Database Settings in the Admin Client.
Figure 12-57 Work Log Configuration Page
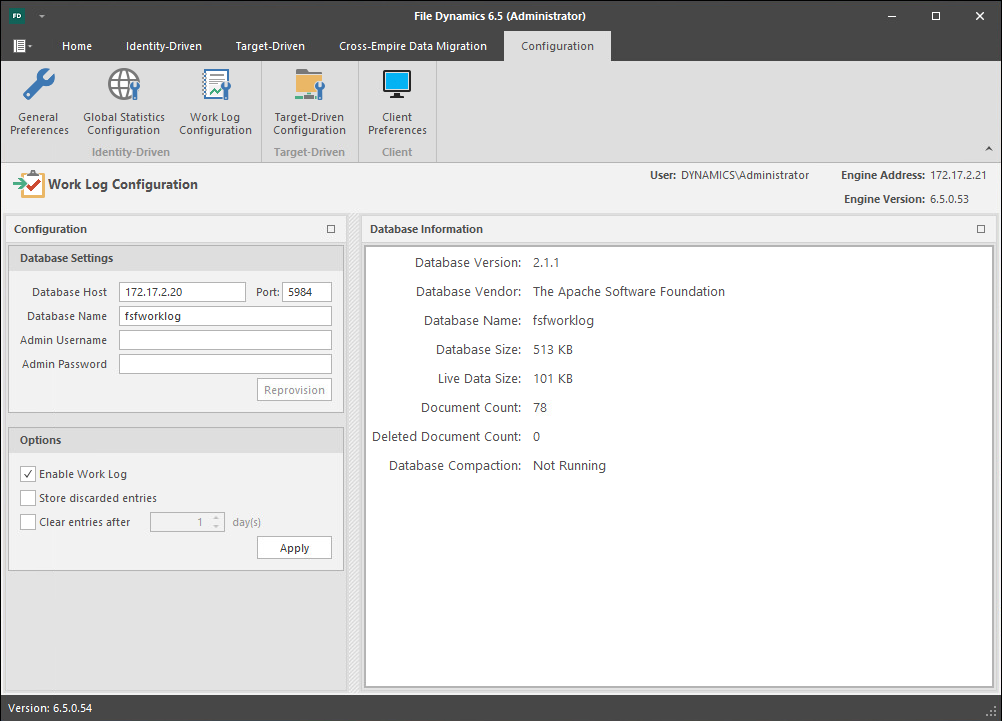
Database Settings: Fields in this region are specific to the CouchDB database.
For information on setting up the CouchDB database, see Section 11.2, Installing CouchDB.
Database Host: Specifies the IP address or DNS hostname of the server hosting the CouchDB database.
Port: Specifies the port number utilized by the CouchDB database.
The default number is 5984.
Database Name: The established name for the CouchDB database instance for the Work Log.
Admin Username: The administrator username you established when you installed the CouchDB database.
Admin Password: The password you established when you installed the CouchDB database.
Reprovision: Once you have entered the username and password, clicking this button re-provisions the user and database for the Work Log.
Options: Fields in this region are specific to the File Dynamics Work Log.
Enable Work Log: Once this option is selected, events will be recorded as entries in the Work Log.
Store Discarded Entries: Store Work Log entries for events where no action is ultimately taken, such as a user created outside the scope of any policy.
Clear Entries After: Select this option to specify the number of days before an entry is cleared. Once cleared the entry will not be listed in the Work Log.
Apply: Click to apply the settings in the region.
12.5.4 Target-Driven Configuration
Use this page to establish the CouchDB database settings for all security-based Target-Driven policies, as well as for Workload policies.
Figure 12-58 Target-Driven Configuration Page
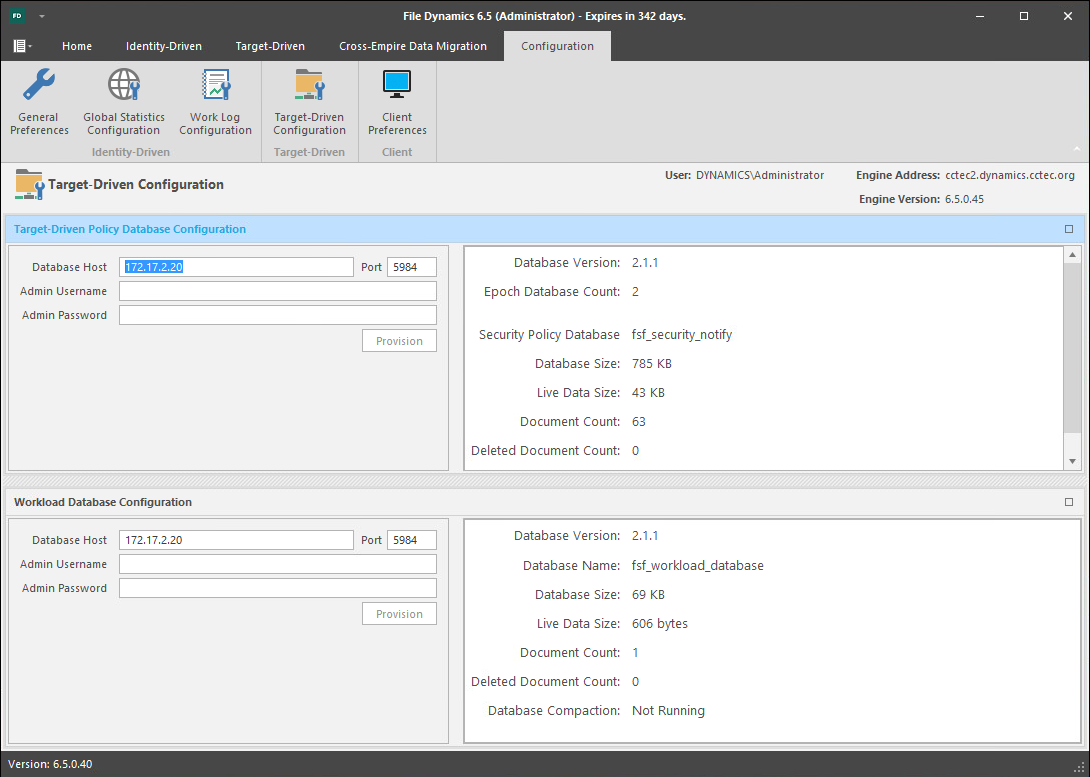
Target-Driven Policy Database Configuration: This region is specific to the CouchDB database instance for security-based Target-Driven policies.
Database Host: Enter the IP address or DNS host name or the server hosting CouchDB.
Port: Set the port address to 5984.
Admin Username: Enter the username for the previously-installed CouchDB instance.
Admin Password: Enter the password for the previously-installed CouchDB instance.
Provision: Click to provision the database instance.
Workload Database Configuration: This region is specific to the Couch DB database instance for Workload policies.
NOTE:The results of Workload actions are stored in a CouchDB instance and can be accessed via the Data Owner Client.
Database Host: Enter the IP address or DNS host name of the server hosting Couch DB.
Admin Username: Enter the username for the previously-installed CouchDB instance.
Admin Password: Enter the password for the previously-installed Couch DB instance.
Provision: Click to provision the database instance.
12.5.5 Client Preferences
Use this page to set preferences specific to the File Dynamics Admin Client.
Figure 12-59 Client Preferences Page
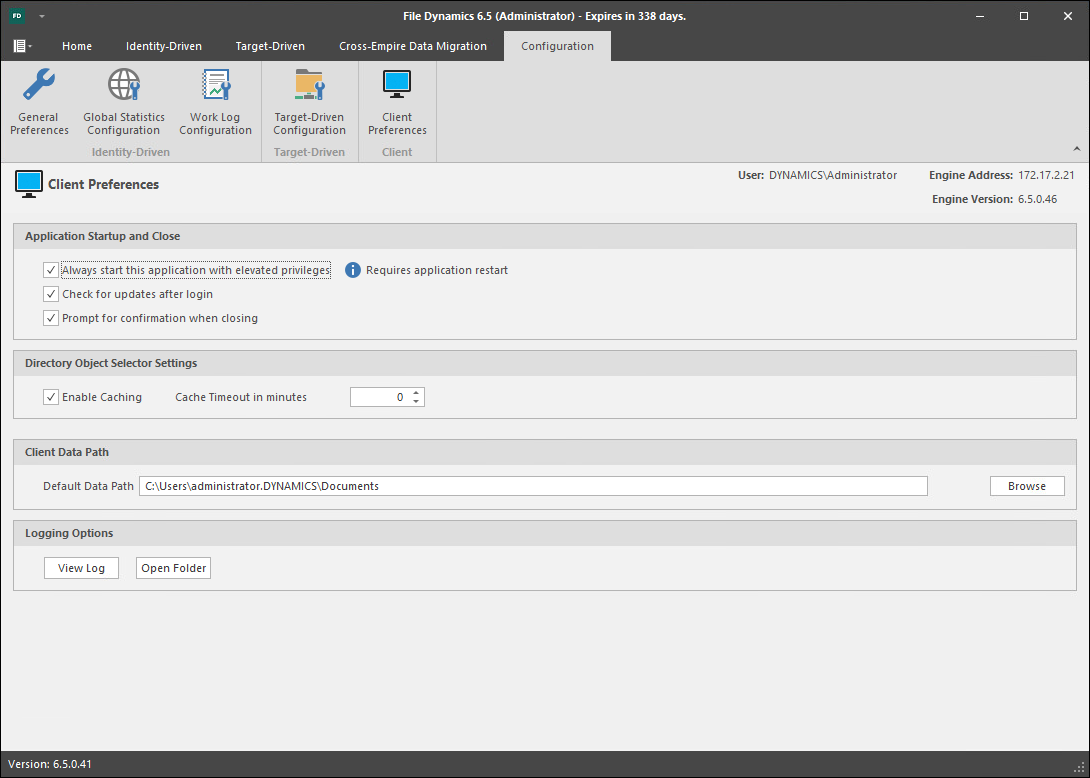
Application Startup and Close: This region provides preference settings for when the Admin Client is launched and closed.
Always start this application with elevated privileges: When selected, this option allows you to run the Admin Client as the Administrator, enabling you to view settings that are not visible to non-administrators. For example, Server Share properties can only be seen when someone is logged in as an administrator.
Check for updates after login: Selecting this check box allows the Admin Client to notify you of the availability of newer Micro Focus File Dynamics components.
Prompt for confirmation when closing: When selected, this option specifies that you want a confirmation prompt before closing the Admin Client.
Directory object Selector Settings: This region lets you establish caching settings specific to the Admin Client.
Enable Caching: Selecting this check box enables the Admin Client to maintain the area of the directory tree that is visible in the right pane of the Objects page, if you move from the Objects page to another. For example, if you locate a Group object in a container and then need to move to another page, when you return to the Objects page, you do not need to navigate the directory tree to locate the Group object again.
Cache Timeout in minutes: In large enterprises, it can take a long time to build up the directory services cache. In these type of environments, consider increasing this setting so that you can use the cache, instead of querying directory services again for information.
Default Data Path: This field specifies the location where all exported reports are stored. For example, if you were to export a Consistency Check report as a CSV or HTML file, it would be saved in this location.
Browse: Locate the destination where you want exported reports stored.
Logging Options: This region enables you to access the Admin Client’s log files.
View Log: Clicking this button opens the log file.
Open Folder: Clicking this button opens the folder where the Admin Client’s compressed log files are stored.