7.1 Useful Tools for Troubleshooting the Access Gateway Appliance
7.1.1 Useful Tools
Table 7-1 describes some of the tools available in the Linux operating system or installed by the Access Gateway that can help you determine the cause of a problem.
Table 7-1 Useful Tools
|
Tool |
Description |
|---|---|
|
|
If you have an Access Gateway that does not seem to be using the current configuration, you can use the Administration Console to push the current configuration to the Access Gateway. Click > . In the section, select an Access Gateway, then click . |
|
icon |
In the Administration Console, click the icon to view details about the health of the Access Gateway. For more information, see Section 4.8.2, Monitoring the Health of an Access Gateway. |
|
curl |
Use this command to view identity provider metadata from the Access Gateway. See |
|
tail -f |
Use this command to view real time activity in key log files. For information on useful files to tail, see Using Log Files and Touch Files to Troubleshoot the Access Gateway Appliance. |
|
proc |
Use this command to check resources available on the system. |
|
netstat /ss |
Use this command to view statistics about the listeners on the Access Gateway. |
|
netcat |
Use this command to access the Access Gateway console, which displays statistics and information about various processes. For more information, see Using the Access Gateway Appliance Console. |
|
tcpdump |
Use this command to capture data on standard and loopback interfaces and to view SSL data with imported keys. |
|
nash |
Use this command to manually configure log level verbosity and to replace IP addresses. For log level information, see Access Gateway Appliance Logs. |
|
/etc/init.d/novell-vmc |
Use the novell-vmc command line options to restart the proxy and view status. For more information, see Table 7-2. |
|
The /chroot/lag/opt/novell/bin directory contains the following scripts: |
|
|
getlaglogs.sh |
Generates a /var/log/laglogs.tar.gz file of the install and system log files. For more information, see Access Gateway Logs. |
|
lagupgrade.sh |
Use this script to apply patches. For more information, see |
|
lagconfigure.sh |
Use this script to resolve auto-import issues. For more information, see |
You can use the following commands to stop and start the Access Gateway and to view its status.
Table 7-2 novell-vcm Commands
7.1.2 Using the Linux Access Gateway Monitor Service
The Linux Access Gateway monitor service checks the disk usage and proxy services. If the proxy services enter into non-responsive state, the monitor service restarts the proxy services automatically.
You can use the following commands to start, stop, add, remove, and view the status of lagmonitor service.
7.1.3 Using the Access Gateway Appliance Console
-
To access the console, run the following command:
netcat localhost 2300
-
Press Enter at the Please enter terminal type prompt.
This displays the Access Gateway console screens.
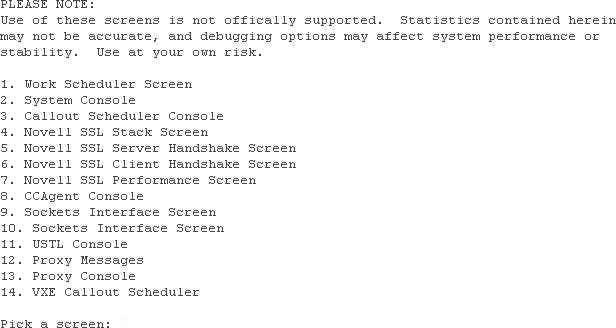
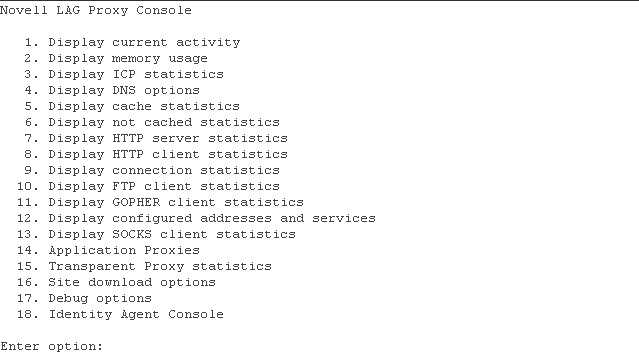
Most of the time, the Proxy Console screen is the one you should pick. The other screens are used mainly by the developers of the Access Gateway. If you are having SSL connection problems, the SSL screens can help in diagnosing the problem.
-
To access the Proxy Console screen, enter 13.
-
To access a specific screen, enter the number.
Screen
Description
1. Display current activity
Displays information about connections (server and client), cached objects, and HTTP requests.
2. Display memory usage
Displays information about memory pools and memory used and the types of objects stored in memory.
3. Display ICP statistics
Displays statistics for the Internet Cache Protocol.
4. Display DNS options
Displays statistics and information about the entries in the DNS table.
5. Display cache statistics
Displays information about cached objects and the COS partition.
For more information, see Checking if the COS Partition Is Mounted.
6. Display not cached statistics
Displays statistics about requests for objects that cannot be cached.
7. Display HTTP server statistics
Displays statistics about the server handling of HTTP requests.
8. Display HTTP client statistics
Displays statistics about the client handling of HTTP requests.
9. Display connection statistics
Displays general information about connections.
Displays statistics about FTP client requests.
10. Display FTP client statistics
11. Display GOPHER client statistics
Displays statistics about GOPHER requests.
12. Display configured addresses and services
Displays information about the IP addresses that the Access Gateway is using.
13. Display SOCKS client statistics
Displays statistics about SOCKS client requests.
14. Application Proxies
Displays proxy service statistics.
15. Transparent Proxy statistics
Displays transparent proxy statistics.
16. Site download options
Displays information about the last download and prompts for information to schedule a new download.
17. Debug options
Allows you to control cache purging.
18. Identity Agent Console
Displays user information.
For more information about the user screen, see User Details.
-
To return to the opening page of the console from other console pages, press Esc+Enter.
This keystroke works might not work on some pages.
-
To exit the console, press Ctrl+C.
7.1.4 Viewing Configuration Information
The configuration store maintains two versions of the Access Gateway configuration and the browser cache maintains one.
-
Current: The current configuration is the version of the configuration that the Access Gateway is currently using.
You can view this configuration in file format by clicking > > > > . Do not set a password to encrypt the file. The exported file contains the current configuration.
-
Working: The working configuration is the version that you have saved by clicking the button on the Server Configuration page, but you have not applied the changes by clicking the or the link on the Access Gateways page. This version is not viewable from the Administration Console.
-
Browser Cache: All configuration changes are saved to the browser cache when you click the button on a configuration page. To view the configuration currently in the browser cache, click > > , scroll to the section, then click . You can view the cached configuration of an individual Access Gateway, or if the Access Gateway is a member of a cluster, you can view the cached configuration of the cluster and each member. The + and - buttons allow you to expand and collapse individual configurations.