10.7 Enabling Monitoring and Configuring the Monitor Script
Resource monitoring allows Novell Cluster Services to detect a the resource failure independently of its ability to detect node failures. Monitoring is disabled by default. It is enabled separately for each cluster resource.
10.7.2 Configuring Resource Monitoring
The resource monitoring function allows you to monitor the health of a specified resource by using a script that you create or customize. If you want Novell Cluster Services to check the health status of a resource, you must enable and configure resource monitoring for that resource. Enabling resource monitoring requires you to specify a polling interval, a failure rate, a failure action, and a timeout value.
If you are creating a new cluster resource, the Monitor Script page should already be displayed. You can start with Step 6.
-
In iManager, select > .
-
Select the cluster that you want to manage.
If the cluster does not appear in your list, add the cluster to your list as described in Section 8.2, Setting Up a Personalized List of Clusters to Manage.
-
Select the tab.
-
Click the cluster resource to open its Properties page.
You can also select the check box next to the resource, then click .
-
On the Properties page, click the tab.
-
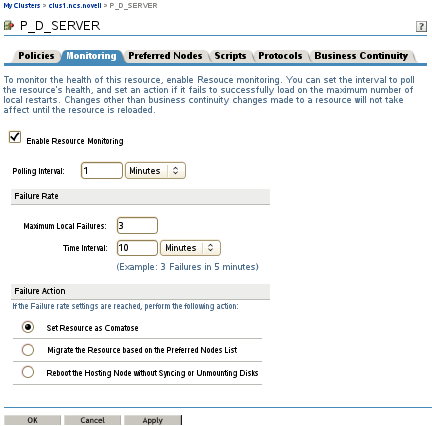
Select the check box to enable resource monitoring for the selected resource.
Resource monitoring is disabled by default.
-
For the polling interval, specify how often you want the resource monitor script for this resource to run.
You can specify the value in minutes or seconds.
-
Specify the number of failures () for the specified amount of time ().
See Failure Rate.
-
Specify the by indicating whether you want the resource to be set to a comatose state, to migrate to another server, or to reboot the hosting node (without synchronizing or unmounting the disks) if a failure action initiates. The reboot option is normally used only for a mission-critical cluster resource that must remain available.
See Failure Action.
-
Click the tab, then click the link.
-
Edit or add the necessary commands to the script to monitor the resource on the server.
The resource templates included with Novell Cluster Services for Linux include resource monitor scripts that you can customize.
You also need to personalize the script by replacing variables with actual values for your specific configuration, such as the mount point, IP address, volume group name, file system type, and mount device.
You can use the same commands that would be used at the Linux terminal console. For example, see Section 10.7.3, Monitoring Services that Are Critical to a Resource.
-
Specify the value, then click to save the script.
The timeout value determines how much time the script is given to complete. If the script does not complete within the specified time, the failure action you chose in Step 9 initiates.
-
Do one of the following:
-
If you are configuring a new resource, click , then continue with Section 10.9.2, Setting the Start, Failover, and Failback Modes for a Resource.
-
Click to save your changes.
Changes for a resource’s properties are not applied while the resource is loaded or running on a server. Apply the updated script by taking the resource offline and then bringing it online on the same node. Alternatively, after the updated scripts have been synchronized from eDirectory to the source and destination nodes, the updated scripts are used automatically on system failover or cluster migration. For more information, see Section 10.8, Applying Updated Resource Scripts by Offline/Offline, Failover, and Migration.
-