5.2 Report Explorer
The Report Explorer is used to organize and generate reports.
5.2.1 Report Explorer Template Nodes
The Report Explorer hierarchy consists of template nodes that have various types of report templates.
Table 5-3 Report Explorer Template Nodes
|
Template Node |
Report Templates |
Node Description |
|---|---|---|
|
Analysis |
Application - Exchange Workloads Application - SQL Server Workloads Disk - Average 30 Day Forecast Disk - Peak Hardware Utilization - Average 30 Day Forecast Hardware Utilization - Peak Memory - Average 30 Day Forecast Memory - Overutilized Memory - Peak Memory - Underutilized Network -Average 30 Day Forecast Network - Peak Processor - Average 30 Day Forecast Processor - Overutilized Processor - Peak Processor - Underutilized Resource Utilization Trend Workload Size - Average 30 Day Forecast Workload Size - Peak |
For reporting dynamic data such as hardware utilization and workload sizes. |
|
Chargeback |
Cost Allocation |
For reporting the transfer of charges incurred by the IT department back to the business units that are using services. See Section 7.4, Chargeback Reporting. |
|
Consolidation |
Project Scenario Summary Workload Assignment |
For reporting on projects, scenarios, and servers in the Consolidation Planning Module. See Section 6.5, Viewing Consolidation Reports for information on how to use templates within this node. |
|
Consolidation Project Samples |
Good Consolidation Candidates Inventory Summary Poor Consolidation Candidates Utilization Summary Workload List with Conditional Formatting |
Commonly used sample consolidation reports. |
|
Diagnostics |
Error Report Missing Data - Detailed Missing Data - Summary |
For diagnosing errors that cause monitoring data to be missing from a chart. |
|
Disk |
Disk Inventory |
For reporting the size and type of physical disks on machines. |
|
Inventory |
Hardware - Obsolete Hardware Inventory Power and Cooling Virtual Machine Server Candidates Virtual Machine State VM Files Report VM Snapshots Report VM Sprawl Report |
For reporting static data such as operating system, processor speed, memory, disk space, network, power, and cooling. |
|
Reclamation |
Disk Reclamation Memory Reclamation Powered On VMs Reclamation Volume Reclamation |
For reporting on elements that can be reclaimed to ensure efficient use of resources. |
|
Software |
Application > Application Inventory Application Complete > Application Complete Inventory Processes > Process Inventory Service > Service Inventory Service Complete > Service Complete Inventory |
For reporting installed applications, services, and running processes. |
|
Virtual Infrastructure |
Cluster Configuration Resource Pool Configuration VI Configuration VirtualCenter Report VM Cluster VM Details Report VM Resource Pool VM Virtual Infrastructure |
For reporting on virtual machines and virtual machine hosts. |
|
Volume |
Volume Inventory |
For reporting the space and file system associated with each logical volume on machines. |
As shown in Table 5-3, within each report node are one or more templates that you can use as is or that you can customize with sorting, filtering, and view selection options. You can add additional Analysis, Chargeback, Disk, Inventory, Software, and Volume report templates.
5.2.2 Commands
The following Report Explorer commands are accessible by right-clicking a report template or a generated report:
Table 5-4 Report Explorer Commands

5.2.3 Analysis Reports
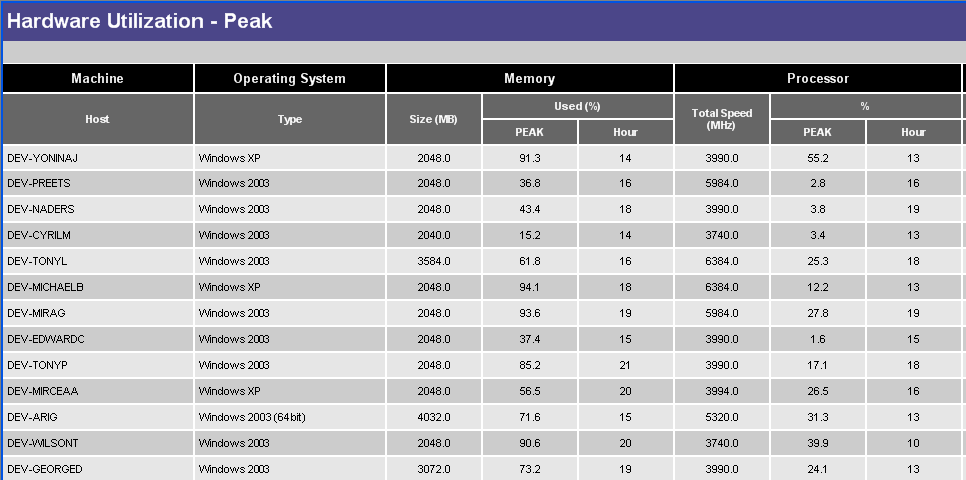
Analysis reports use dynamic data such as hardware utilization and workload sizes. To view workloads or utilization of servers that are being monitored, generate an Analysis report. The report is displayed with historical data, which is useful for getting a single value (maximum, minimum, peak, average) for expressions over a specified period of time. Use this data to identify over-utilized or under-utilized server resources.
NOTE:Data must be collected for at least one hour before Analysis reports are generated. If there is insufficient data, the report is displayed without dynamic data.
To get detailed historical data for each data point, click the report cell to view the related detailed chart.
Machines without monitoring data are included in Analysis reports by default to allow complete analysis of all inventoried machines.
Figure 5-2 Sample Analysis Report
5.2.4 Working with Report Templates
Creating a Report Template
-
Right-click the report type node in the Report Explorer for the type of report that you want to create, then select from the menu.
The Create Report Template dialog box is displayed.
-
Define the template settings, using the procedures and guidelines for editing an existing template. See Section 5.3, Editing Report Templates.
-
Click .
The new template is displayed under the report type node in the Report Explorer.
Copying a Report Template
-
Right-click the report template you want to copy in the Report Explorer and select from the menu.
The Edit Report Template dialog box is displayed with (COPY) added to the template name.
-
(Optional) Edit the template name.
-
Click .
The new copy of the template is displayed in the Report Explorer.
Deleting a Report Template
-
Right-click the report template you want to delete in the Report Explorer and select from the menu.
The Confirm Delete dialog box is displayed.
-
Click .
The report template is removed from the Report Explorer.