5.5 Using Reports
The Reporting Service provides Adherence and Status reports for the enterprise. The available data is provided for directories and user groups within a directory. Novell reports provide feedback on the effects individual policy components can have on enterprise endpoints. Requests for these reports are set in the Security Policy (see Section 6.2.4, Compliance Reporting) and provide useful data to determine policy updates.
The following sections contain more information:
5.5.1 Using the Reports Tools
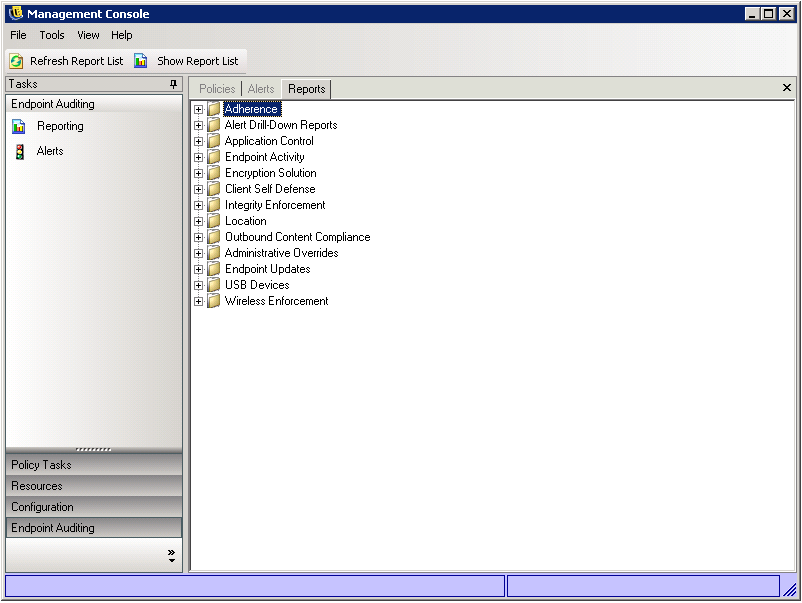
You can select from either the Endpoint Auditing taskbar or from the menu. The list of available reports displays (click on the "plus" sign icons next to each report type to expand the list).
Figure 5-8 Reports Menu
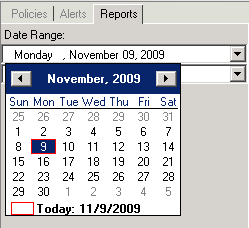
Reports are configured by identifying the date range and other parameters (for example, user or location). To set the dates, select the report, click , click the date selector to expand to the calendar view, then select the month and day (be sure to click on the day to change the date parameter).
Figure 5-9 Use calendar tool to set the date-range
Click to generate the report.
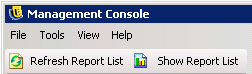
After a report is generated, it can be viewed through the Management Console, printed, e-mailed, or or exported as a .pdf file by using the Report toolbar.
Figure 5-10 Report Toolbar

When reviewing reports, the arrow buttons help you navigate through each page of the report. Reports typically have charts and graphs on the first page, with the gathered data on the remaining pages, ordered by date and type.
Use the button to print the full report using the default printer for this computer.
Use the button to save the report as a PDF file, Excel spreadsheet, Word document, or RTF file for distribution.
Use the button to toggle a list of parameters to the side of the report. Select any of these parameters to drill down farther into the report. Click the button to close the sidebar.
Use the button to display a drop-down menu to adjust the current view size.
Use the button to open a search window.
When you mouse over a certain parameter, such as a user name or device name, the mouse pointer changes to a magnifying glass. You can double-click that particular item and display a new report for just that object. Click the button to close the current view and return to the original report.
To return to the report list, click the icon above the report window.
Figure 5-11 Report list icon
Reports are not available until data has been uploaded from the Endpoint Security Clients. By default, the ZENworks Endpoint Security Management Reporting service syncs every 12 hours. This means that reporting and alerts data will not be ready until 12 hours have passed from installation. To adjust this time frame, open the Configuration tool (see Scheduling), and adjust the Client Reporting time to the number of minutes appropriate for your needs and your environment.
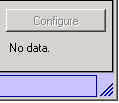
Reports that do not have data available will have the or button grayed out, with the words No data underneath.
Figure 5-12 No data
5.5.2 Adherence Reports
Adherence Reports provide compliance information about the distribution of security policies to managed users. A score of 100 percent adherence indicates that all managed users have checked in and received the current policy.
Click the plus sign next to to expand the list to display the following reports:
Endpoint Check-In Adherence
Provides a summary of the days since check-in by enterprise endpoints, and the age of their respective current policy. These numbers are averaged to summarize the report. This report requires no variables be entered. The report displays the users by name, which policies have been assigned to them, the days since their last check-in, and the age of the policy.
Endpoints that Never Checked-In
Lists the user accounts that have registered with the Management Service but have never checked with the Distribution Service for a policy update. Select one or more groups to generate the report.
NOTE:These may be Management Console users who don't have a Security Client installed in their names.
Endpoint Client Versions
Lists the most recently reported version of the client on each endpoint. Set the date parameters to generate this report.
Group Policy Non-Compliance
Lists groups in which some users do not have the correct policy. Selections can be made for one or more groups to generate the report.
Endpoint State History by Machine
Lists the most recent status (in a given date-range) of ZENworks Endpoint Security Management-protected endpoints, grouped by machine name. It displays the logged-on user name, current policy, ZENworks Endpoint Security Management client version, and network location. This report requires a range of dates to be entered. The administrator can drill down by double-clicking any entry to see a complete list of status reports for a particular machine.
Policy Assignment
Lists the users or groups (accounts) that have received the specified policy. Select the desired policy from the list and click to run the report.
Endpoint State History by User
Lists the most recent status (in a given date-range) of ZENworks Endpoint Security Management-protected endpoints, grouped by user name. It displays the machine name, current policy, Endpoint Security Management client version, and network location. This report requires a range of dates to be entered. The administrator can drill down by double-clicking any entry to see a complete list of status reports for a particular user.
5.5.3 Alert Drill-Down Reports
Additional alert information is available in these drill-down reports. These reports only display data when an alert has been triggered. Clearing an alert also clears the alert report; however, the data is still available in a standard report.
Click the plus sign next to to expand the list to display the following reports:
Client Tampering Alert Data
Lists instances where a user has made an unauthorized attempt to modify or disable the Endpoint Security Client.
Files Copied Alert Data
Lists accounts that have copied data to removable storage.
Incorrect Client Version Alert Data
Displays the history of the status of the ZENworks Security Client Update process.
Incorrect Client Policy Alert Data
Lists users who do not have the correct policy.
Override Attempts Alert Data
Lists instances where client self-defense mechanisms have been administratively overridden, granting privileged control over the Endpoint Security Client.
Integrity Failures Alert Data
Displays the history of success/failure client integrity checks.
Port Scan Alert Data
Lists the number of blocked packets on the number of different ports (a large number of ports may indicate a port scan occurred).
Uninstall Attempt Alert Data
Lists users who have attempted to uninstall the Endpoint Security Client.
Unsecure Access Point Alert Data
Lists unsecured access points detected by the Endpoint Security Client.
Unsecure Access Point Connection Alert Data
Lists unsecured access points connected to by the Endpoint Security Client.
5.5.4 Application Control Reports
Lists all unauthorized attempts by blocked applications to access the network or run when not permitted by the policy.
Click the plus sign next to to expand the list to display the following report:
Application Control Details
Lists the date, location, the action taken by the Endpoint Security Client, the application that attempted run, and the number of times this was attempted. Dates display in UTC.
Enter the date parameters, select the application names from the list, select the user accounts, and click to run the report.
5.5.5 Endpoint Activity Reports
Endpoint Activity reports provide feedback for individual policy components and the effect they have on the operation of the endpoint.
Click the plus sign next to to expand the list to display the following reports:
Blocked Packets by IP Address
Lists blocked packets filtered by the destination IP address. Dates display in UTC.
Select the destination IP from the list and set the date parameters. The report displays the dates, locations, affected ports, and the name of the blocked packets.
Blocked Packets by User
Lists blocked packets filtered by users. Dates display in UTC. The data provided is essentially the same as , but arranged by user.
Network Usage Statistics by User
Lists packets sent, received, or blocked; and network errors, filtered by users. This report requires a range of dates to be entered. Dates display in UTC.
Network Usage Statistics by Adapter Type
Lists packets sent, received, or blocked; and network errors, filtered by adapter type. This report requires a range of dates to be entered and the Location. Dates display in UTC.
5.5.6 Encryption Solutions Reports
When endpoint encryption is activated, reports on the transference of files to and from the encrypted folders is monitored and recorded.
Click the plus sign next to to expand the list to display the following reports:
File Encryption Activity
Lists files that have had encryption applied.
Encryption Exceptions
Lists errors from the encryption subsystem (for example, a protected file could not be decrypted because the user did not have the right keys).
5.5.7 Client Self Defense Reports
Client Self Defense reports provide feedback about users trying to prevent the Endpoint Security Client from doing its job.
Click the plus sign next to to expand the list to display the following report:
Endpoint Security Client Hack Attempts
Lists instances where a user has made an unauthorized attempt to modify or disable the Endpoint Security Client. Dates display in UTC.
Specify the date parameters, then click to run the report.
5.5.8 Integrity Enforcement Reports
Provides reporting for anti-virus/anti-spyware integrity results.
Click the plus sign next to to expand the list to display the following reports:
Client Integrity History
Lists the success and failure of client integrity checks. Dates display in UTC.
Select the date range for the report, integrity rule(s), and user name(s).
Unremediated Integrity Failures by Rule
Reports on integrity rules and tests that have failed and not yet been remediated.
Select the integrity rules, then click to run the report.
Unremediated Integrity Failures by User
Reports on users that have failed integrity tests and not yet been remediated.
Select the user names, then click to run the report.
5.5.9 Location Reports
Provides data for common location usage (which locations are most commonly used by users).
Click the plus sign next to to expand the list to display the following report:
Location Usage Data by Date and User
Displays information gathered from individual clients about what locations are used and when. Dates display in UTC. The locations displayed are the locations used by the user. Unused locations are not displayed. Select the date range to generate the report.
5.5.10 Outbound Content Compliance Reports
Provides information regarding the use of removable drives and identifies which files have been uploaded to such drives.
Click the plus sign next to to expand the list to display the following reports:
Removable Storage Activity by Account
Lists accounts that have copied data to removable storage. No parameters are required to generate this report.
Removable Storage Activity by Device
Shows removable storage devices to which files have been copied. Select the date range, user names, and locations to generate this report.
Copies from Removable Storage by Account
Shows accounts that have copied data from removable storage to fixed drives.
Detected Removable Storage Devices
Lists removable storage devices that have been detected on the endpoint. Select the date range, user names, and locations to generate this report.
Chart 7 Days of Removable Storage Activity by Account
Displays a chart listing accounts that have recently copied data to removable storage. Enter the date range to generate this report.
5.5.11 Administrative Overrides Reports
Reports instances where client self-defence mechanisms have been administratively overridden, granting privileged control over the Endpoint Security Client.
Click the plus sign next to to expand the list to display the following report:
Security Client Overrides
Displays successful override attempts by user and date. Dates display in UTC.
Select the user and date range, then click to run the report.
5.5.12 Endpoint Updates Reports
Shows the status of the ZENworks Security Client Update process (see ZSC Update). Dates display in UTC.
Click the plus sign next to to expand the list to display the following reports:
Chart Percentage of ZSC Update Failures
Lists the percentage of ZENworks Security Client Update that have failed (and not been remediated). No parameters are required to generate this report.
History of ZSC Update Status
Shows the history of the status of the ZENworks Security Client Update process. Select the date range and click to run the report. The report displays the users that have checked in and received the update.
Chart Types of Failed ZSC Updates
Shows ZENworks Security Client Updates that have failed (and not been remediated). Select the date range and click to run the report. The report displays the users that have checked in, but had a failed update installation.
5.5.13 USB Devices Reports
Shows security client USB device inventory that is listed by user or machine. This report shows whatever a user has plugged into a USB port and is recorded for either the user or the machine.
5.5.14 Wireless Enforcement Reports
Provides reports regarding Wi-Fi environments the endpoint is exposed to.
Click the plus sign next to to expand the list to display the following reports:
Wireless Connection Availability
Displays the access points available for connection by policy and location. Includes the channel, SSID, MAC address, and whether or not the access point was encrypted.
Wireless Connection Attempts
Displays the access points connection attempts, by location and by ZENworks Endpoint Security Management account.
Wireless Environment History
Provides a survey of all detected access points, regardless of ownership. Includes the frequency, signal strength, and whether or not the access point was encrypted. Dates display in UTC. Select the desired locations and the date range to generate this report.