
  |
To access a Trend Analysis Data window, select a server in the View All window or a View window, or select a server name in the Server drop-down combo box in the left corner of the Tool Bar. Then, either click the Trend Analysis icon in the Tool Bar or choose Server > View Trend Analysis. ConnectView prompts you for starting and ending dates and then opens the Trend Analysis window for the specified period.
NOTE: Connections that terminate while the audit trail option is disabled and connections that terminate beyond the end date of the display period are not included in trend analysis data.
You can also open multiple views of the Trend Analysis window for the same server and the same display period by selecting the opened Trend Analysis window and choosing Window > New.
IMPORTANT: If you are accessing large amounts of data in the current audit trail file and/or archived files, displaying trend analysis data could require a substantial amount of time and memory. Also, if low memory conditions occur and Windows is configured to swap data to disk, this could increase the amount of time required to process the data.
Refer to the following procedures:
For sample Trend Analysis windows and explanations, see Interpreting Trend Analysis Data.
When you are viewing trend analysis data, ConnectView enables you to customize the display of data with several display options. These options appear in the Trend Analysis Display Options dialog box. The available options vary depending on which trend analysis category is selected.
To access the Dialog boxes:Trend Analysis Display OptionsTrend Analysis Display Options dialog boxTrend Analysis Display Options dialog box, ensure that a Trend Analysis window is open and the desired graph is selected. Choose View > Display Options (F4). ConnectView opens the Trend Analysis Display Option dialog box. Specify the desired options and click the OK button.
ConnectView enables you to display two views of data from the same trend analysis category within one window, so you can easily compare data from the same category for different intervals.
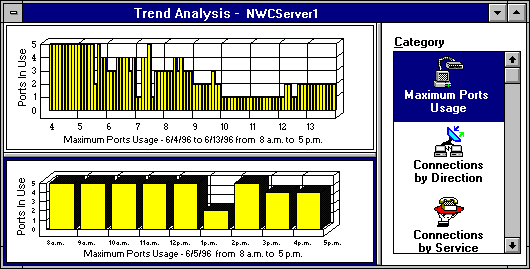
To display a split trend analysis window, position the cursor over the upper gray border of the window (just under the Title Bar) until it changes shape to parallel lines with two arrows. Press and hold the left mouse button. Drag the border to the desired position and release the mouse button. Click the icon for the desired category. Figure 18 shows an example split window with maximum port usage data.
Figure 18
Trend Analysis Split Window
To limit the data display in either graph, select the desired graph. A dark border appears around the selected graph. Choose View > Display Options (F4). ConnectView opens the Trend Analysis Display Options dialog box for the selected graph.
NOTE: If the Category list box is in focus and you have split windows, a dialog box appears so you can specify to which graph to apply the display options.
ConnectView enables you to save trend analysis data to a file so that you can view trend analysis graphs independent of the server's audit trail and archived files.
To save trend analysis data, open the Trend Analysis window for the desired period and choose File > Save Trend Analysis. ConnectView prompts you for a path and filename and then saves the data for the specified period to a trend analysis file. Trend analysis files have a .TAD extension.
To access a previously saved trend analysis file, choose File > Open Trend Analysis. The File Open dialog box appears. Specify the desired trend analysis file (file with a .TAD extension) and click OK. ConnectView opens the Trend Analysis window and displays the saved data.
NOTE: Use the DOS command or Windows File Manager to delete trend analysis files.
ConnectView enables you to print the graphs from any Trend Analysis window, copy the trend analysis graph in bit map or text format to the Windows clipboard, or export trend analysis data in tab-delimited format. This capability allows you to create and maintain trend analysis records for detailed reports and analyses.
To copy graphs from a Trend Analysis window in text or bit map format, select the category you wish to copy. A dark border appears around the selected graph. Choose Edit > Copy. ConnectView prompts you to choose graph or bit map format. Select the desired format and click OK.
ConnectView copies the graph data in the specified format to the Windows clipboard. You can then paste the text or bit map into other applications.
To print a graph from a Trend Analysis window, select the category you wish to print. A dark border appears around the selected graph. Choose File > Print. ConnectView prints the selected graph.
IMPORTANT: To print graphs, some printers could require configuration changes.
To export trend analysis data, select the trend analysis category you wish to export. A dark border appears around the selected graph. Choose File > Export. ConnectView prompts you to specify a filename and path. Specify the desired path and click the OK button.
ConnectView exports data in tab-delimited format to the specified file. You can then import the data into other applications for additional analysis.
  |