61.3 Generating Reports
You can generate reports on demand at the Monitor Agent consoles to help you manage message flow throughout your GroupWise system.
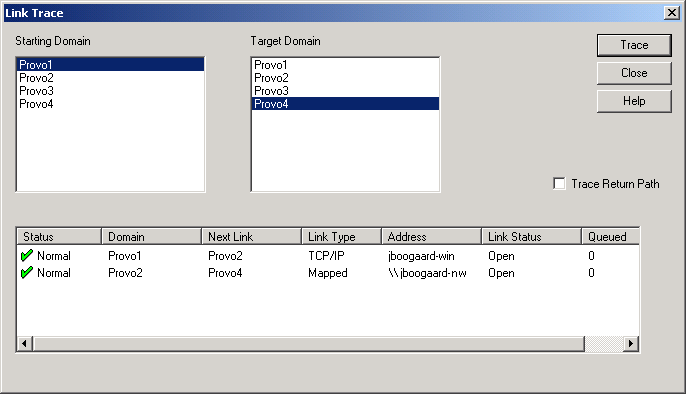
61.3.1 Link Trace Report
A link trace report enables you to follow the path a message would take between two GroupWise domains. A link trace report includes a list of all the domains through which a message would need to pass, along with their current status, link type, address, and number of messages currently queued in each domain. If any domain along the link path is closed, an error message is displayed.
If a message fails to arrive at its destination, this report can help you pinpoint its current location, so you can resolve the problem and get messages flowing smoothly again.
At the Windows Monitor Agent server console:
-
Click
or
On Linux, at the Monitor Agent Web console, click .
-
Select a starting domain and a target domain.
-
If you want to trace the path back, which is the route status messages will take, select .
-
Click
If any domain in the path is closed, an error message displays so you know where the problem is occurring.
-
When you are finished tracing links, click .
61.3.2 Link Configuration Report
A link configuration report enables you to list the links from one or more GroupWise domains to all other domains in your GroupWise system. This helps you identify inefficient link paths, loops, and unreachable domains. All domains must be open to obtain an accurate link map of your GroupWise system.
-
Make sure all domains in your GroupWise system are open.
You cannot obtain an accurate link map of your GroupWise system if any domains are closed. For assistance with closed domains, see
Message Transfer Agent Problems
in GroupWise 7 Troubleshooting 2: Solutions to Common Problems.At the Windows Monitor Agent server console:
-
Click
or
On Linux, at the Monitor Agent Web console, click
-
Select
or
Select a specific agent from the drop-down list.
-
Click
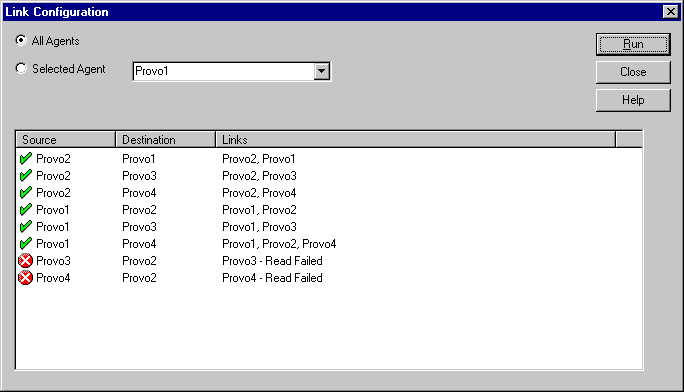
The list shows what domains a message would pass through to travel from the domain in the column to the domain in the column. If a domain displays as closed, it means that the Monitor Agent could not contact the MTA for the domain or that a loop was detected in the link configuration.
-
When you are finished checking links, click .
61.3.3 Image Map Report
An image map enables you to create a visual picture of your GroupWise system, whether it resides in a single office building or spans the globe. You provide the maps; Monitor provides the up-to-the-minute status information at a glance.
NOTE:The image map report cannot be generated at the Windows Monitor Agent server console. You must use the Monitor Agent Web console.
Making Maps Available in Monitor
-
Obtain useful maps from the Internet or other location.
You can use maps that vary in detail. For example, you could have one map the focuses on a particular corporate office building, another that shows offices throughout your country, and another that shows offices throughout the world. You can select from images in PNG and JPG format.
-
Copy the maps you want to use into the maps subdirectory of the monwork directory.
The default location of the monwork directory varies by platform.
You can change the location using the /monwork startup switch. For more information, see Section 63.0, Using Monitor Agent Switches
-
Continue with Setting Up Maps.
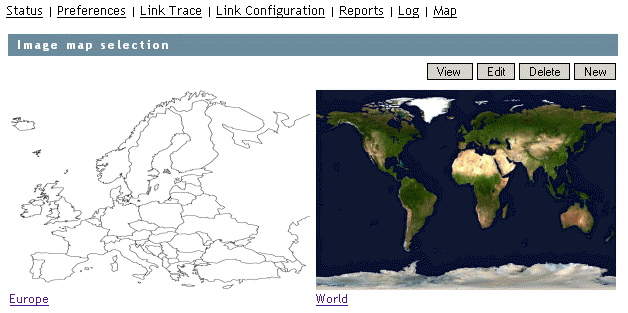
Setting Up Maps
-
In the Monitor Agent Web console, click .
Initially, no maps are available in Monitor.
-
Click to display all the maps that are available in the maps directory.
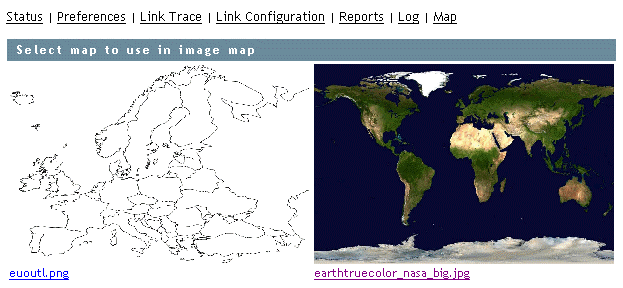
The filename of each map is displayed below it.
-
Click the map that you want to set up, specify a custom name for the map, then click .
This makes the map available for use in Monitor.
-
To set up additional maps for use in Monitor, click to return to the Image Map Selection menu, then repeat Step 2 and Step 3 for each map that is available in the maps directory to make it available in Monitor.
-
If you want to make one or more smaller-scale maps available from a large-scale map, continue with Setting Up Regions.
or
If your maps are all independent from each other, skip to Adding Agents to a Map.
Setting Up Regions
If some of your maps are subsets of other maps, you can set up a large-scale map so that it links to one or more smaller-scale maps. For example, a map of the world could have a region for each continent or country, or a map of a city or country could have a region for each office where GroupWise domains or post offices are located.
-
Set up at least two maps in Monitor, as described in Making Maps Available in Monitor.
-
In the Monitor Agent Web console, click to display the maps that are available in Monitor.
The custom name of each map is displayed below it.
-
Click , then click a large-scale map.
-
In the drop-down list, scroll down through the agents, click the smaller-scale map that you want to define as a region, then click on the large-scale map to refresh the view.
-
Click points on the map to surround the region.
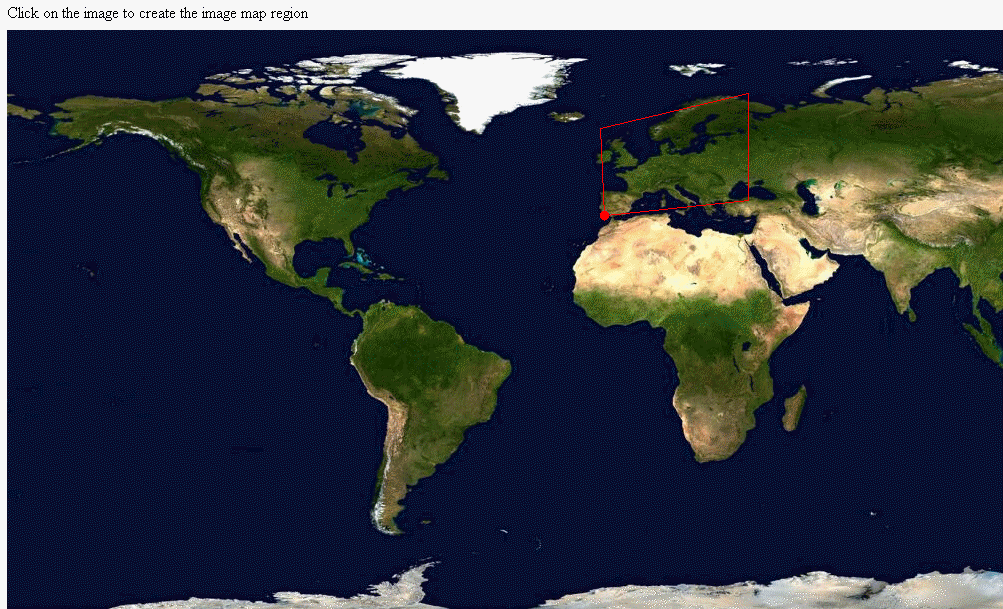
-
Click to define the region.
NOTE:With a very wide map, you need to scroll horizontally to display the button.
The region appears labeled on the large-scale map.

-
To define more regions on the large-scale map, click to return to the available maps, then repeat Step 3 through Step 6 for each region.
or
To place agents on a map, continue with Adding Agents to a Map.
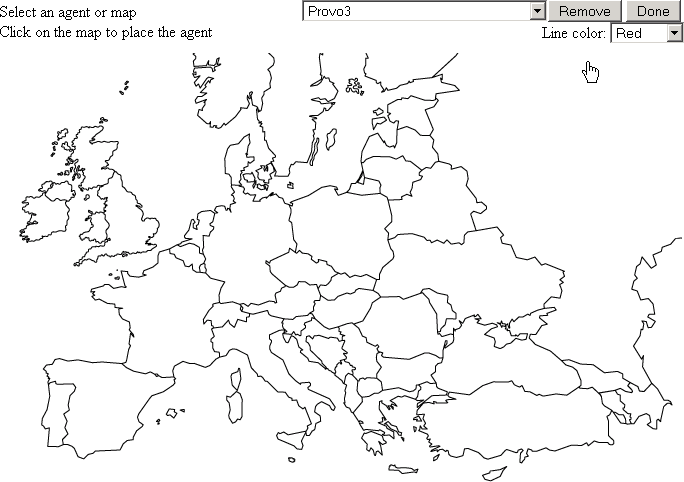
Adding Agents to a Map
-
In the Monitor Agent Web console, click to display the maps that are available in Monitor.
The custom name of each map is displayed below it.
-
Click , then click the map where you want to add agents.
-
Select an agent in the drop-down list, then click the place on the map where that agent is located.
The agent name appears in a blue box.
-
Select additional agents and locations as needed.
-
In the drop-down list, select the color to use to show links between locations.
Make sure you select a color that shows up well on the particular map. Lines display on the map only when links between locations are down.
-
Click when the map includes all the needed GroupWise agents in their respective locations.
-
Continue with Using an Image Map to Monitor Agents
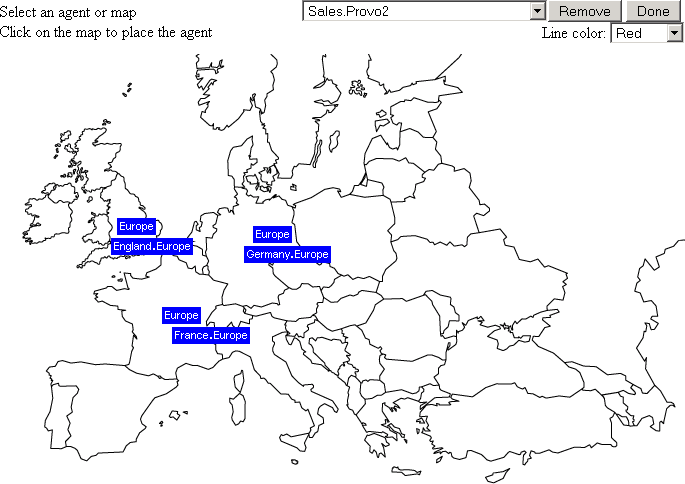
Using an Image Map to Monitor Agents
-
In the Monitor Agent Web console, click .
-
Click a map to view agent status.
or
If the map has regions, click a region to display the map that has agent status for that region.
At this point, the Monitor Agent checks the status of each agent on the map. Any agent that is down or that has a status of , , or displays in red on the map. Agents with a lower status do not display on the map. If a link between agents is down, a line displays between the agents.
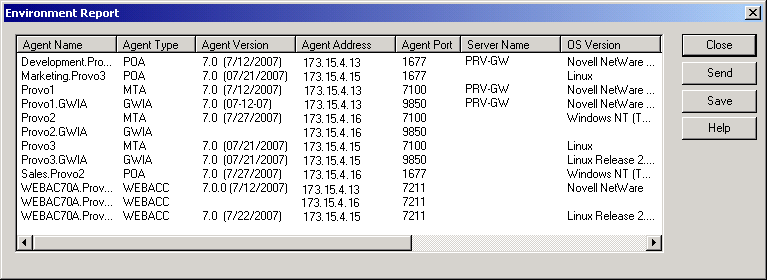
61.3.4 Environment Report
An environment report lists all monitored agents, along with each agent’s location, version, IP address, port number, and operating system information. For NetWare® agents, the server name, CLIB version, TCP/IP version, Novell eDirectory™ version, and the number of packet receive buffers are also listed.
At the Windows Monitor Agent server console or the Monitor Agent Web console:
-
Click .
-
Scroll through the displayed information for your own use.
or
Click , type your e-mail address, type one or more e-mail addresses to send the environment report to, then click .
-
Click to close the Environment Report dialog box.
61.3.5 User Traffic Report
A user traffic report enables you to determine how many messages a user has sent outside his or her post office. The user traffic report lists all messages sent by a specified user during a specified date/time range, along with date, time, and size information for each message. You can also generate a user traffic report for all users whose messages pass through a selected domain.
In order for the information to be available to generate a user traffic report, you must configure the MTA to perform message logging. See Section 41.4.2, Enabling MTA Message Logging.
At the Windows Monitor Agent server console or the Monitor Agent Web console:
-
Click .
-
Select the user’s domain or the domain you want to generate a user traffic report for.
-
Type the GroupWise user ID that you want to create a report for.
or
Leave the field blank to create a report for all users whose messages pass through the selected domain.
-
If you want to restrict the report to a particular time interval, specify start and end dates and times.
-
Click .
-
After the results are displayed, click , provide a filename for the report, select the format for the report, then click .
Reports can be saved in comma-separated or tab-separated format to meet the needs of the program you plan to use to display and print the report. For example, you could bring the data into a spreadsheet program. If needed, you can include column headings to create an initial line in the output file that labels the contents of each column.
-
When you are finished generating user traffic reports, click .
61.3.6 Link Traffic Report
A link traffic report enables you to determine how many messages are passing from a selected GroupWise domain across a specified link. The link traffic report lists the total number and total size of all messages passing through the link during each hour or half hour of operation.
In order for the information to be available to generate a link traffic report, you must configure the MTA to perform message logging. See Section 41.4.2, Enabling MTA Message Logging.
At the Windows Monitor Agent server console or Monitor Agent Web console:
-
Click .
-
Select the source domain of the link.
The list includes all domains that the Monitor Agent uses XML to communicate with. If the Monitor Agent must use SNMP to communicate with a domain, that domain is not included in the list.
-
Select the other end of the link, which could be another domain, a post office, or a gateway.
-
If you want to restrict the report to a particular time interval, specify start and end dates and times.
-
Click .
-
After the results are displayed, click , provide a filename for the report, select the format for the report, then click .
Reports can be saved in comma-separated or tab-separated format to meet the needs of the program you plan to use to display and print the report. For example, you could bring the data into a spreadsheet program. If needed, you can include column headings to create an initial line in the output file that labels the contents of each column.
-
When you are finished generating link traffic reports, click .
61.3.7 Message Tracking Report
A message tracking report enables you to track an individual message through your GroupWise system. The message tracking report provides information about when a message was sent, what queues the message has passed through, and how long it spent in each message queue. If the message has not been delivered, the message tracking report shows where it is.
In order for the information to be available to generate a message tracking report, you must configure the MTAs in your GroupWise system to perform message logging. See Section 41.4.2, Enabling MTA Message Logging.
In addition, you need to determine the message ID of the message. Have the sender check the Sent Item Properties of the message in the GroupWise client. The Mail Envelope Properties field displays the message ID of the message; for example, 3AD5EDEB.31D : 3 : 12763.
At the Windows Monitor Agent server console or Monitor Agent Web console:
-
Click .
-
Type the message ID of the message to track.
You can obtain the message file ID in the GroupWise client. Open the Sent Items folder, right-click the message, click , then check the field for the message file ID; for example, 3A75BAB9.FF1 : 8 : 31642.
-
Select the domain where you want to start tracking.
-
Click .
-
When you are finished generating message tracking reports, click .
61.3.8 Performance Tracking Report
Before you can run a performance tracking report, you must configure the Monitor Agent for performance tracking. See Section 61.4, Measuring Agent Performance.
61.3.9 Connected User Report
The Connected Users report lists all users that are currently connected to POAs throughout your GroupWise system. It lists username; client version, date, and platform; login time; and the IP address of the client user.
At the Monitor Agent Web console:
-
Click .
NOTE:The Connected Users report cannot be generated at the Windows Monitor Agent server console or the Monitor Web console.
61.3.10 Gateway Accounting Report
Before you can run a gateway accounting report, you must configure the Monitor Agent to collect gateway accounting data. See Section 61.5, Collecting Gateway Accounting Data.
61.3.11 Trends Report
The Trends report presents graphs of agent MIB variables as sampled over time.
In the Monitor Agent Web console:
-
Click .
NOTE:The Trends report cannot be generated at the Windows Monitor Agent server console.
-
Click the type of agent for which you want to set up a Trend report.
-
Specify a unique name for the Trend report.
-
Select the MIB variables that you want to collect values for over time, then click .
The Trend report appears in the list.
-
Click the Trend report to view the graphs.
61.3.12 Down Time Report
The Down Time report graphically illustrates how much time each GroupWise agent has been down during the day.
In the Monitor Agent Web console:
-
Click
NOTE:The Down Time report cannot be generated at the Windows Monitor Agent server console.