3.11 Viewing Inventory Data and Monitoring Servers
On completion of an inventory operation, you can view inventory data on servers that are listed in the Data Center Explorer tree. To view dynamic data, servers must be monitored for a period of time.
3.11.1 Viewing Properties
Properties can assist with viewing static data for inventoried servers. To view inventory information, right-click a server and click .
Figure 3-8 Sample View of the Properties Dialog Box
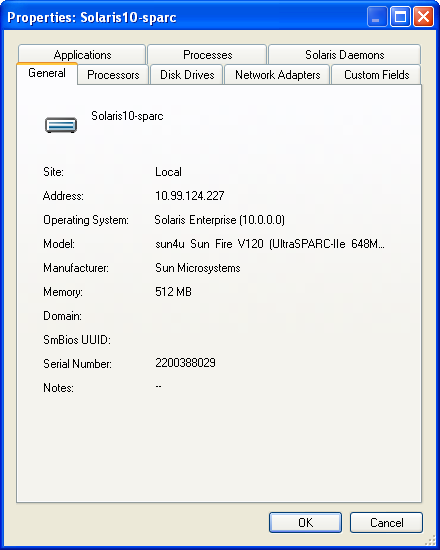
The tabs available in the Properties dialog box change based on the type of server being viewed.
3.11.2 Refreshing the Inventory
To refresh server inventory information in the Data Center Explorer, right-click a server or multiple servers and click on the menu. Inventory Refresh jobs are scheduled and run in the Job Explorer.
3.11.3 Collecting Dynamic Data by Monitoring Servers
-
Right-click the inventoried server and click , or monitor multiple servers by selecting them or their parent group, filter, or site, then click .
A job is created in the Job Explorer. For more details, refer to Section 4.2, Job Explorer.
-
After data is collected, click the server to view the corresponding chart in the Chart Viewer. With at least five minutes of data collected, the Chart Viewer can display workloads and utilization data.
To stop monitoring, right-click the monitored server and select . In the confirmation dialog box, click to confirm or to exit the dialog box and continue monitoring.
Although PlateSpin Recon might not be currently monitoring a server, it is still possible to view charts and reports showing the previously collected server data.
You can monitor multiple servers by selecting them individually or by using groups, filters, or sites.
3.11.4 Viewing Dynamic Data
You can view workloads and utilization data in a chart after collecting at least five minutes worth of data. Analysis Reports require a minimum of one hours worth of data. If there is insufficient data, the report is displayed without dynamic data. You can view collected data in a chart by selecting a monitored server.
See Section 5.1, Chart Viewer and Section 5.2, Report Explorer for more information.
3.11.5 Viewing Logs
Log files reflect the status of data collection for monitored servers. To inspect a log, right-click a server and click .
3.11.6 Custom Fields
Custom fields are available for entering server information that cannot be inventoried by PlateSpin Recon. These non-inventory fields can assist with identifying candidates for planning and consolidation. The information is stored in the visible table name.
You can specify the custom fields in one of the following ways:
Manually Specifying the Custom Fields
To specify custom fields for multiple servers:
-
Select a server or multiple servers in the Data Center Explorer.
-
Right-click the selection and click for a single server, or click for multiple servers.
The Properties dialog box is displayed.
-
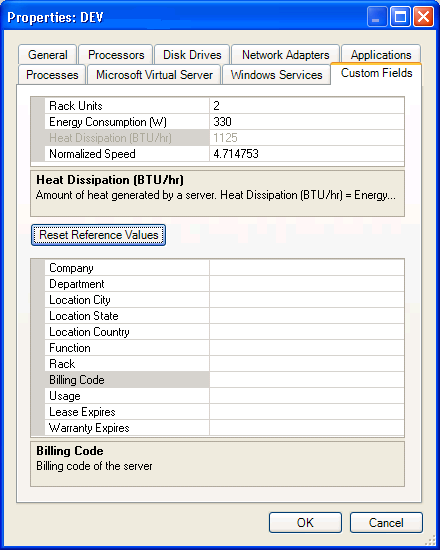
Click the tab.
-
Select a field to view its definition and parameters.
Figure 3-9 Custom Fields
-
Type or select information in any of the fields, including those already filled with data.
-
Click .
If necessary, click to return all fields to their default values.
The database is updated for the selected servers. Report templates can filter for particular custom fields.
Importing the Custom Fields
PlateSpin recon allows you to import the custom fields for all the servers in the local site.
-
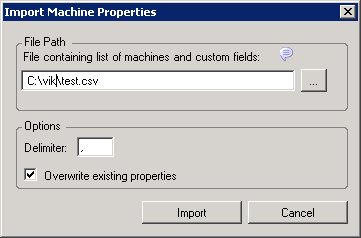
In the Data Center Explorer, click > .
The Import Machine Properties dialog box is displayed.
Figure 3-10 Import Machine Properties
-
Type the path (or use the adjacent browse button) to locate a CSV file containing custom fields.
Ensure to follow these guidelines as you work with the CSV file:
-
The first line must contain the label of the custom fields separated by a delimiter such as a comma (,).
-
The first custom field label on the first line must be Machine. You can list the remaining custom fields in any order.
-
You must use the following custom field labels only:
- Rack Units
- Normalized Speed
- Company
- Department
- Location City
- Location State
- Location Country
- Function
- Rack
- Billing Code
- Usage
- Lease Expires
- Warranty Expires
-
The custom field label names are case sensitive.
-
The values for the custom fields must be specified subsequent to the first line, and must be corresponding to the custom fields.
-
Each line must contain the custom fields for a machine.
-
The value for the Machine custom field can be IP address or the machine name. The specified machine name must be unique.
-
The values on each line must be separated by a delimiter such as a comma (,).
A sample CSV file is as follows:
Machine,Rack Units,Company,Lease Expires,Warranty Expires
1.x.x.x,130,Novell,11/25/2009,1/1/2010
-
-
Specify the delimiter used in the CSV file. By default, it is a comma (,).
-
(Conditional) If you want to replace the existing custom fields with the values contained in the CSV file, select the option. By default, the option is selected.
-
Type or select information in any of the fields, including those already filled with data.
-
Click .