


The SilverStream Debugger lets you find and fix runtime errors in your Java applications by controlling and monitoring the execution of Java source code. You can debug client-side and server-side objects, either on a local host machine or remotely on distributed machines.
You can also run the Debugger as a standalone tool for debugging any Java application, even if the application was developed outside the SilverStream environment.
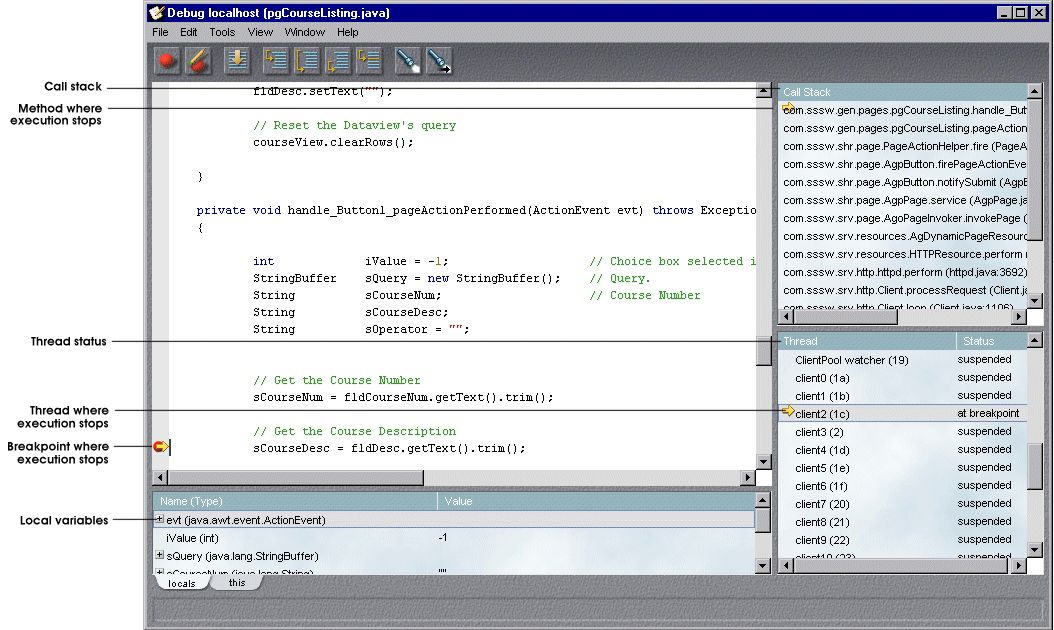
Here is a sample Debugger window, showing many of its features:
This page describes the following:

You should review the following concepts before you use the Debugger.
A breakpoint is a specific line in your code where you want execution to stop temporarily. When you set a breakpoint in code, the program stops running before executing the line containing the breakpoint, then turns control over to the Debugger.
Deadlock occurs when two or more threads have locks on different objects, but are waiting for one of the other locked objects to free up. Since the threads are waiting for each other to complete and release their locks, none of the threads can run.
An instance variable occurs in every instance of a specific created class. It is a non-static variable.
A local variable is declared inside a particular method. Only code that is contained in the method can access a local variable.
In Java, a monitor is an exclusive lock on an object. Locks are used in thread synchronization.When methods are programmed to be synchronized, they cannot run concurrently. When a synchronized method is entered, it acquires a monitor on the current object (the object whose method was called). The monitor prevents other synchronized methods in the object from executing. When the synchronized method returns, its monitor is released, allowing other synchronized methods in the same object to run.
A thread is a single execution stream in a program. Java is a multi-threaded language which means that you can have several execution streams operating at one time. In Java threads are represented by the Thread object.
The SilverStream Debugger provides you with the following capabilities for diagnosing and correcting problems with your Java applications:
You can debug the following objects in SilverStream:
The Debugger is tightly integrated with the Designer. You can invoke the Debugger from the Programming Editor in the Designer to develop and debug your application in the same environment.
Alternatively, you can start up the Debugger as a standalone process to troubleshoot Java applications that are developed outside the SilverStream environment. This approach allows you to debug externally-developed applications without having to start up the Designer.
You can troubleshoot your applications on a local host or remotely in a distributed environment, whether you invoke the Debugger from the SilverStream Designer or as a standalone process. For more information, see Local and Remote Debugging.
The Debugger provides methods for exercising source code by:
To help you isolate problems in source code, the Debugger provides viewers for examining variables, the call stack, and thread status at any point in program execution.
With the SilverStream Debugger you can troubleshoot Java applications running on a local host or remotely in a distributed network. You can configure a process to be debugged either on the local machine or on the remote machine, but not for both in the same session.
There are many situations that require remote debugging. Here are examples of scenarios you might encounter:
 For more information about how to debug applications locally or on remote machines, see
Launching the Debugger from the Programming Editor and
Launching the Debugger as a standalone tool.
For more information about how to debug applications locally or on remote machines, see
Launching the Debugger from the Programming Editor and
Launching the Debugger as a standalone tool.
The SilverStream Debugger is a versatile tool. You can invoke the Debugger for local or remote debugging, either from the Programming Editor in the SilverStream Designer or as a separate process. When deciding how to use the Debugger to meet your specific needs, consider these questions:
Do you want to design and debug your Java application in one integrated environment?
If the answer is yes, you can develop your application using the SilverStream Designer and then start up the Debugger from the Programming Editor. Because the Debugger is tightly integrated with the Programming Editor, you do not need to explicitly load source files. The Debugger can locate your source code automatically. You can also switch easily between design mode and debug mode to modify source code and test your changes.
You can perform local or remote debugging when you run the Debugger from the Programming Editor in the Designer.
See Launching the Debugger from the Programming Editor.
Are your Java applications developed outside the SilverStream environment?
If you want to debug externally-developed Java applications, you must invoke the Debugger as a standalone process. When running standalone, the Debugger can be configured either to start up the application on the local machine, or attach to an application that is already running on a local host or on a remote machine.
See Launching the Debugger as a standalone tool.
Do you want to invoke the Debugger quickly for a short debugging session?
If expediency is important, invoke the Debugger is as a standalone process (thereby bypassing the Designer).
See Launching the Debugger as a standalone tool.
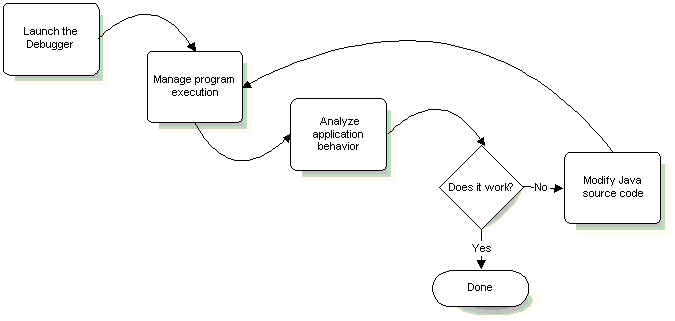
Although each debugging session poses its own unique challenges, you would typically follow this work flow when you are ready to troubleshoot your application:
When you are debugging pre-built applications that reside in databases you have added to your server, you need to give the Debugger local access to the source code. SilverStream provides a local compile cache directory where the SilverStream Designer stores source and class files when compiling Java code.Typically named compilecache, this directory is located in your root SilverStream installation directory.
There are two ways to load an application's source code and class files to the compilecache directory:
For more information about the compile cache, see the section on compiling in How you'll work in the Programmer's Guide.
When the Debugger cannot locate source code for a particular operation, it prompts you to provide the path to the source file. Either provide the path, or dismiss the prompt and follow directions to either continue execution or step out of the current method.
If you are debugging applications developed in the SilverStream Designer, you probably want to invoke the Debugger from the Programming Editor. Here are the steps to follow:
Start the Server in debug mode for local debugging or remote debugging | |
Start the Server as you normally would. |
This section describes each of these procedures.
 To start the Server for local debugging:
Select SilverStream Server (debug) from the SilverStream program group in the Start menu. | |
|
|
If you plan to debug client objects only, you do not need to start the SilverStream Server in debug mode. Simply select SilverStream Server from the SilverStream program group in the Windows NT Start menu or type the following command on the local host:
<SilverStream installation directory>\bin\SilverServer.exe
To start the Server for remote debugging:
<SilverStream installation directory>\bin\SilverServer.exe +debugremote
To set up the Designer to record debugging information in compiled Java code:
To start the Debugger from the Programming Editor:
For example, if you want to debug a Page, select Pages in the desired database in the left pane, highlight the page name in the right pane, and either double-click it or choose the Design action icon:

If you are debugging a form, you can set breakpoints only if you are programming in Java mode. Breakpoints are not available if you are using Simple Actions mode. To enter Java mode, select the Java mode icon:

If you are debugging objects that can run standalone--such as forms and pages--you can invoke them from the Designers or Programming Editor. Follow these steps:
With the form open the Form Designer or Programming Editor, select the Enter Test Mode icon: | |
Select either of these methods to run pages to trigger the Debugger: |
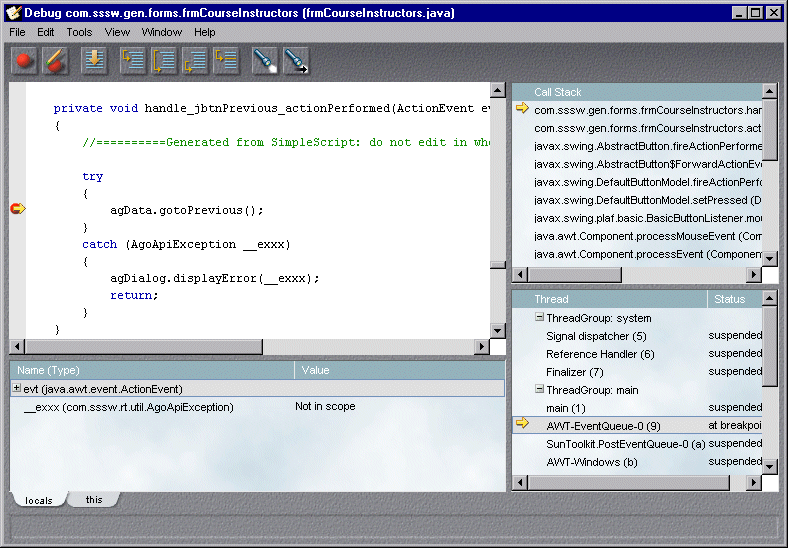
The Debugger is launched when the application reaches the first breakpoint. You will see a Debug window that highlights where execution stops in the source code, call stack, and threads, as in this example:
This window also presents options for managing program execution and analyzing the behavior of the application. For example, this Debug window displays local variables, the call stack, and thread status.
If you are debugging applications developed outside the SilverStream environment, you must invoke the Debugger as a standalone process. When you run the Debugger standalone, you can configure it to either start the application you wish to debug on the local machine, or attach it to an application that is already running either locally or on a remote machine. In either case, you use the SilverDebugger command.
This section describes how to call SilverDebugger to start applications and to attach to running applications.
Launches the SilverStream Debugger as a standalone process. You must specify different options and arguments when you want to start up an application from the Debugger than when you want to attach the Debugger to an application that is already running.
SilverDebugger [options] class arguments
You can specify the following options when starting up a Java application to debug on a local host or remote machine:
Fully-qualified name of Java source file to display in the Debugger. | |
Name of the class that contains the main() entry point to the application.
Arguments to pass to the main() method of class. Typically, arguments are separated by spaces.
SilverDebugger -attach [hostname debug_address | hostname:debug_port]
You must specify one of the following options to attach the Debugger to a Java application already running on a local host or remote machine.
Attach to the JVM running on the local host hostname with address debug_address. | |
Attach to the JVM running on remote machine hostname using port debug_port. |
This section describes how to use the SilverDebugger command to invoke the Debugger as a standalone tool and have it start the application you wish to debug.
To invoke the standalone debugger to start your application:
SilverStream_installation_directory\bin\SilverDebugger.exe [options] class class_arguments
Here is a description of each argument:
The Debugger starts up on your desktop and opens the Java source file you specified on the command line.
Example:
To debug a form whose source code resides in c:\dev\source\mypackage\frmQuery.java in the application myApp.class located in c:\apps\myApp.jar, enter this command:
SilverStream_installation_directory\bin\SilverDebugger.exe -sourcepath c:\dev\source -sourcefile c:\dev\source\mypackage\frmQuery.java -classpath c:\apps\myApp.jar mypackage.myApp

The application opens on your desktop and execution stops at the first breakpoint encountered.
Now you are ready to manage program execution and analyze the behavior of your application.
This section describes how to attach the Debugger to a Java application that is already running. You can attach to an externally-developed Java application or attach to a SilverStream Java application.
When you attach the Debugger to an external Java application, you must pass a number of option settings to the Java Virtual Machine (JVM) when you start up the application. This section describes these options and procedures.
To attach the Debugger to an external Java application:
SilverStream_installation_directory\jre\bin
To launch the application on the local host, follow these steps:
java -Xdebug -Xnoagent -Xrunjdwp:transport=dt_shmem,server=y,suspend=n -Djava.compiler=NONE -classpathclasspathclassname
The JVM returns a debug address, as in this example:
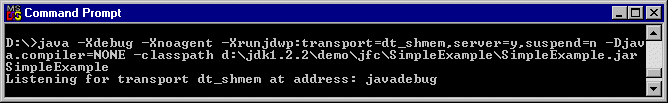
As you can see, the JVM returns javadebug as the debug address. The option transport=dt_shmem specifies shared-memory transport, which is required for local debugging.
To launch the application on a remote network machine, follow these steps:
java -Xdebug -Xnoagent -Xrunjdwp:transport=dt_socket,server=y,suspend=n -Djava.compiler=NONE -classpathclasspathclassname
The JVM returns a debug port number, as in this example:
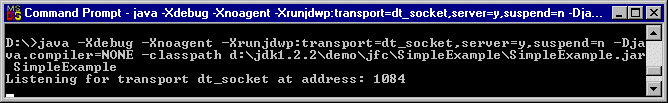
As you can see, the JVM returns 1084 as the debug port. The option transport=dt_socket specifies socket-based transport, which is required for remote debugging.
The Debugger opens on your desktop.
Now you are ready to manage program execution and analyze the behavior of your application.
When you attach the Debugger to a SilverStream executable, such as SilverServer.exe and SilverJRunner.exe, you need only pass debugger options. The correct JVM option settings are automatically generated. This section describes these debugger options and procedures.
Debugger options
This section describes the debugger options to use when launching SilverStream applications that you want to attach to the standalone Debugger. Some of these options override default settings, described in Default debug port and debug addresses.
NOTE You cannot specify +debug:address and +debug:port on the same command line because one option is for local debugging and the other is for remote debugging.
Default debug port and debug addresses
Here are the default debug ports and debug addresses for SilverStream executables:
Default debug port for SilverJRunner.exe and SilverServer.exe |
These default options are used when attaching the Debugger to a SilverStream application.
To attach the Debugger to a SilverStream application:
To launch the application for debugging client objects:
Starts SilverJRunner for local debugging using a default debug address, | |
Starts SilverJRunner for remote debugging using a default debug port, 9901 |
Example: Here is a sample command line that launches a form from the WineDemo3 database in SilverJRunner for local debugging. In this example, c:\SilverStream is the root installation directory.
c:\SilverStream\bin\SilverJRunner.exe localhost WineDemo3 frmEmployees +debug
You can specify a number of suboptions with +debug. See Debugger options for more information. See Starting SilverJRunner for more information on how to invoke SilverJRunner from the command line.
To launch the application for debugging server objects:
Starts SilverServer for local debugging using a default debug address, | |
Starts SilverServer for remote debugging using a default debug port, 9901 |
Example: Here is a sample command line that launches the SilverStream server for local debugging. In this example, c:\SilverStream is the root installation directory.
c:\SilverStream\bin\SilverServer.exe +debug
NOTE agjrn and agsrv are default debug addresses, and 9901 is the default debug port, as described in
Default debug port and debug addresses.
The Debugger opens on your desktop.
Now you are ready to manage program execution and analyze the behavior of your application.
The Debugger offers several ways to manage program execution to allow you to isolate, diagnose, and fix problems in the source code:
You use breakpoints to specify lines in your code where you want to stop execution and give control to the Debugger. When the source code stops executing and the Debugger takes control, you can execute Debugger commands, and view the call stack, thread status, and variable values.
You can set breakpoints only on individual lines in your code. If a line contains multiple statements, you can set a breakpoint only on the first statement in the line. To set breakpoints on the subsequent statements, you need to break up the line so that each statement appears on its own line.
Breakpoints are stored by server name and class name. As a result, objects share breakpoints in the following circumstances:
In these scenarios, breakpoints set in one object will automatically appear in the other related objects and, conversely, breakpoints removed from one object will automatically disappear from the other related objects. If you debug objects that share breakpoints in this way--but contain different versions of code--the results might be unpredictable. To avoid potential problems, it is best not to run or debug different versions of the same application on the same server.
There are several ways to set and remove breakpoints in code, either for local classes or classes loaded from external sources. If the Debugger cannot find the source code, it prompts you for a path, as described in When the Debugger cannot locate source code.
This section describes the procedures for setting and removing breakpoints in source code.
To set breakpoints in code using Toggle Breakpoint:

The breakpoint indicator  appears in the left margin next to the line you specified.
To set breakpoints in code using the Edit menu:
The Manage Breakpoints dialog opens.
The Add Breakpoint dialog opens, showing all breakpoints that exist in the source code for the Java class.
The new breakpoint appears in the Manage Breakpoints dialog.
To remove individual breakpoints using Toggle Breakpoints:
To remove breakpoints using the Edit menu:
The Manage Breakpoints dialog opens.
The breakpoints disappear from the list in the Manage Breakpoints dialog.
The breakpoints disappear from the source code.
![]()
In addition to setting breakpoints in the main body of source code in your Java applications, you can also set breakpoints in standard Java exceptions or in exceptions that you write to handle specific behaviors.
This capability can help you pinpoint the source of exceptions that are thrown unexpectedly when you run your application. When you set a breakpoint in an exception and then run your application, the Debugger will stop where the exception gets thrown and display the offending source code if it is available for the class you are debugging. If the Debugger cannot find the source code, it prompts you for a path, as described in When the Debugger cannot locate source code.
To set breakpoints in exceptions:
The Manage Breakpoints dialog opens.
The Add Exception Breakpoint dialog opens.
The new breakpoint appears in the Manage Breakpoints field.
NOTE Exception breakpoints do not appear in the source code.
To remove breakpoints from exceptions:
The Manage Breakpoints dialog opens.
The breakpoints disappear from the list in the Manage Breakpoints dialog.
The Debugger allows you to enable and disable breakpoints in code and exceptions. Disabled breakpoints appear with a grayed icon:
The Manage Breakpoints dialog opens.
You can select multiple breakpoints by holding down the Control key or Shift key when you click each choice.
The breakpoints you select will be enabled when you continue program execution.
The Manage Breakpoints dialog opens.
You can select multiple breakpoints by holding down the Control key or Shift key when you click.
The breakpoints you select will be disabled when you continue program execution.
The Debugger offers several ways to continue execution after the program stops at a breakpoint:
When a breakpoint is reached, the Debugger window is activated and an arrow appears in the margin to the left of the code indicating which line is about to be executed. This arrow is known as the execution pointer.
Along with the execution pointer, the Debugger displays a list of local and instance variables and enables the commands for stepping through your code.
To start or continue execution:
The Debugger executes your source code until it reaches the next breakpoint.
To run to a specified location in the source code:

Run to Cursor executes your code from the current execution location until it reaches the place where your cursor is located. The cursor must be located on a line that contains executable statements. If you have breakpoints set and a line containing a breakpoint is executed before the line that has the cursor, Run to Cursor stops execution at that breakpoint line.
NOTE If you place your cursor on a line that doesn't get executed -- for example, if your cursor is on the first line of code inside an if statement when the if condition evaluates to false -- the effect of executing Run to Cursor will be the same as if you select the Continue command.
There are several Step commands included in the SilverStream Debugger:
If the current line contains a method call, that method is executed. The Debugger stops at the line immediately following the line that was executed.
If the current line contains a method call, the Debugger stops at the first line in the called method. Otherwise the Debugger stops at the line immediately following the line that was executed.
If the Debugger cannot find the source code for the method it has entered, it prompts you for a path, as described in When the Debugger cannot locate source code.
The Debugger stops at the statement immediately following the statement that called the current method.
The Debugger allows you to examine the current execution state when the Debugger stops at a breakpoint, following a Step command, and when you suspend and resume threads. You can view the following information:
The Debugger provides a viewer that lets you examine the call stack during program execution. The call stack viewer shows the name of each method in the stack, along with its source file and line number.
When you double-click on a method in the call stack viewer, the source file opens in the Debugger, highlighting the line where the method is called. If the Debugger cannot find the source file, it prompts you for a path, as described in When the Debugger cannot locate source code.
The call stack viewer updates the call stack when:
To open the call stack viewer:
A pane for viewing the call stack appears in the Debugger window.
The Debugger provides a viewer that lets you examine the status of threads during program execution. The thread viewer displays threads organized by groups, showing the name of each thread, along with its identifier and state.
You can suspend and resume threads to isolate problems that occur in thread synchronization, such as deadlocks and infinite loops.
The thread viewer updates thread status when:
A pane for viewing threads appears in the Debugger window.
Threads can exhibit a variety of states during program execution:
Thread was running when execution stopped at the breakpoint. | |
Thread is waiting for a monitor to be released by another thread. NOTE In a deadlock situation, you will see two or more threads in this state. However, threads that appear in this state do not necessarily indicate a deadlock. |
If you encounter an infinite loop or deadlock in a thread, you can isolate the problem by suspending the thread and viewing its call stack. You cannot view the call stack of a thread unless it is suspended.
To suspend a thread and view its call stack:
Double-click a running or waiting thread in the thread viewer. |
The call stack for the selected thread appears in the call stack viewer.
If the Debugger cannot locate the source code for a method you selected, it will prompt you to supply a path, as described in When the Debugger cannot locate source code.
NOTE If you double-click on a waiting thread, the method that put the thread in a wait state appears in the call stack viewer.
Resume execution of your application by:
| |
The Debugger provides a viewer that lets you examine local and instance variables when program execution stops at a breakpoint. The variable viewer displays the variable name, type, and value.
The variable viewer updates variable values when:
A pane for viewing variables appears in the Debugger window.
If you run the Debugger from the Programming Editor in the SilverStream Designer, you can easily switch between a debugging session and code editing session. Once you finish inspecting your code using the Debugger, you can return to the Programming Editor to modify the code for the class you are debugging.