


The SilverStream Profiler allows you to identify and analyze performance bottlenecks in your Java code caused by inefficient methods, memory leaks, and monitor contention.
The Profiler is based on Sun Microsystems' Java Virtual Machine Profiler Interface (JVMPI), included in Java Development Kit (JDK) 1.2. The Profiler runs only in Windows NT.
You can run the Profiler against any SilverStream executable. Most commonly, you would profile processes running on the Server (SilverServer.exe), and client-side applications running in SilverJRunner (SilverJRunner.exe).
Here is one view of the Profiler that shows the time spent in the method com.sssw.shr.page.AgpPage.service(). In this case, the Profiler was invoked against the SilverStream Server.
 See
Using the Profiler for a complete description of runtime requirements.
This page describes the following information about the Profiler:

You should understand the following concepts before you use the Profiler.

Garbage collection is the process of deallocating objects that are no longer referenced. In Java, garbage collection is dynamic and automatic.
When you create an object, Java automatically assigns the correct amount of memory for the object in the heap. When the object is no longer required, you do not have to explicitly free up the memory used by that object. Instead, the Java garbage collector looks for unused objects--objects with no referents--and automatically reclaims the memory allocated to them. Even with automatic garbage collection, memory leaks can occur in Java when programs fail to release references to objects that are no longer used--a situation that sometimes arises, for example, when static references are not cleaned up in code. If a Java program holds references to an object--even if the object is stale--the Java garbage collector cannot deallocate the object from memory.

In programming, a heap is an area of memory reserved for data that is created by a process at runtime. In Java, the heap contains all objects allocated and executed in the Java Virtual Machine (JVM).

In the traditional sense, a memory leak is an object that is no longer referenced, but has not been deallocated. Java provides built-in garbage collection that automatically deallocates objects that have no referents. Even so, memory leaks can occur in Java when programs fail to release references to objects that are no longer used--for example, when Java programs fail to clean up static references.
As memory leaks grow to include a large number of objects, they consume considerable storage space. As a result, memory leaks can significantly slow down program execution and might cause an exception to be thrown if it runs out of space to allocate for new objects.

In Java, a monitor is an exclusive lock on an object. Locks are used in thread synchronization.When methods are programmed to be synchronized, they cannot run concurrently. The synchronized keyword is used to mark code that cannot be accessed by more than one thread at the same time. This code is called a critical section. A critical section is often a complete method, but can also encompass smaller segments of code.
When a synchronized method is entered, it acquires a monitor on the current object (the object whose method was called). The monitor prevents other threads from entering the critical section of code in that object. When the synchronized method returns, its monitor is released, allowing other threads to run the method.

Monitor contention occurs when threads cannot continue execution because they are waiting to acquire monitors on objects that have not yet been released by other threads.

A thread is a single execution stream in a program. Java is a multi-threaded language, which means that you can have several execution streams operating at one time. In Java, threads are represented by the Thread object.

In the Profiler, the term watermark is used in the Heapdump tool to indicate the largest number of objects that were allocated when taking a snapshot of the heap.


You can invoke the Profiler in Windows NT to profile processes running in SilverStream applications. The following table shows which applications are most commonly used with the Profiler:
|
Example: Applications launched from pages that run as servlets in a browser | ||
Profiling applications with client and server components
You can also profile applications that implement client-side and server-side processes--for example, a form running as a standalone client application that invokes a data source object to query and download data from a database on the server. Follow these guidelines:
Client-side and server-side processes in the same application | SilverJRunner on a client machine and SilverServer on a server machine |

The Profiler provides a Timing tool and a Heapdump tool for isolating bottlenecks and inefficiencies in your processes.
Timing tool
The Timing tool lets you determine how much time is spent in particular methods and how the time is distributed across nested calls.
Heapdump tool
With the Heapdump tool, you can take multiple snapshots of the heap allocated for your process. By establishing a baseline and comparing subsequent heap dumps, you can isolate memory leaks. You can differentiate objects that are actively referenced from those that are stale and should be deallocated.
In addition, you can take snapshots of monitor objects to pinpoint areas of monitor contention that are blocking concurrent thread execution.

For large applications, the Profiler loads sizable amounts of data and, therefore, consumes large amounts of memory. To minimize the impact on your system performance, you should not launch multiple profilers on the same machine.

You launch the Profiler in Windows NT by using the +profile option when you invoke SilverStream applications that start JVMs--such as SilverStream Server and SilverJRunner.
At startup, the Profiler opens on your desktop like this:
CAUTION! There are versions of Sun Microsystems' HotSpot JVM that do not support the Java Virtual Machine Profiler Interface (JVMPI), the interface upon which the SilverStream Profiler is based. Therefore, if you run a version of HotSpot that does not support JVMPI, you must use a special command line option, +classic, when you invoke the Profiler. The +classic option suppresses HotSpot and runs the classic JVM--the original implementation of the JVM--to ensure compatibility. This section describes how to use these command line options.
 To launch the Profiler with the SilverStream Server:
NOTE installation_directory is the directory where you installed the SilverStream Server.
SilverServer.exe +profile plus other relevant command-line options, as follows:
Example:
Assume you have installed the SilverStream Server in c:\SilverStream. If you run a version of HotSpot that does not support JVMPI and you do want detailed timing information from the Profiler, type this command:
SilverStream\bin\SilverServer.exe +profile +Djava.compiler=none +classic
Now you are ready to evaluate method timing, walk the object heap, and analyze monitor objects.
 For more information on starting the SilverStream Server, see Running the Server in the Administrator's Guide.
 To launch the Profiler with SilverJRunner:
NOTE installation_directory is the directory where you installed SilverJRunner.
SilverJRunner.exe [protocol:]hostname[:port] database_name form_name +profile plus other relevant command-line options, as follows:
Example:
Assume you have installed SilverJRunner in c:\SilverStream. In addition, assume you want to run the form frmMyForm, which resides in the database MyDatabase on the SilverStream Server localhost. If you do run HotSpot--but a version that does not support JVMPI--and you do want detailed timing information from the Profiler, type this command:
SilverStream\bin\SilverJRunner.exe localhost MyDatabase frmMyForm +profile +Djava.compiler=none +classic
Your application opens in SilverJRunner, initially displaying the form you specify on the command line.
Now you are ready to evaluate method timing, walk the object heap, and analyze monitor objects.
 For more information about installing and starting SilverJRunner, see the deployment chapter in the Programmer's Guide.

You use the Timing tool in the Profiler to analyze how long methods take to complete and to identify time sinks. This section describes how to measure the duration of a method and interpret the timing data provided by the Profiler.

By recording duration multiple times for the same method, you can get an accurate benchmark of how long the method takes to run and determine whether it is consistently slow.
Before you can measure the duration of a method, you must launch the Profiler against a SilverStream Java application--such as SilverServer or SilverJRunner--and then start the application.
 For more information, see
Launching the Profiler.
 To measure the duration of a method:

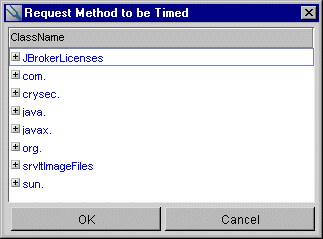
The Request Method to be Timed window appears, showing all packages used by your Java process, as in this example:
NOTE You can select only one method at a time.
The following example shows how to select the pgRequestBegin() event handler for the home page pgSilverBooks of the Silver Books sample application, running in a browser. In this case, the Profiler was invoked with the SilverStream Server.
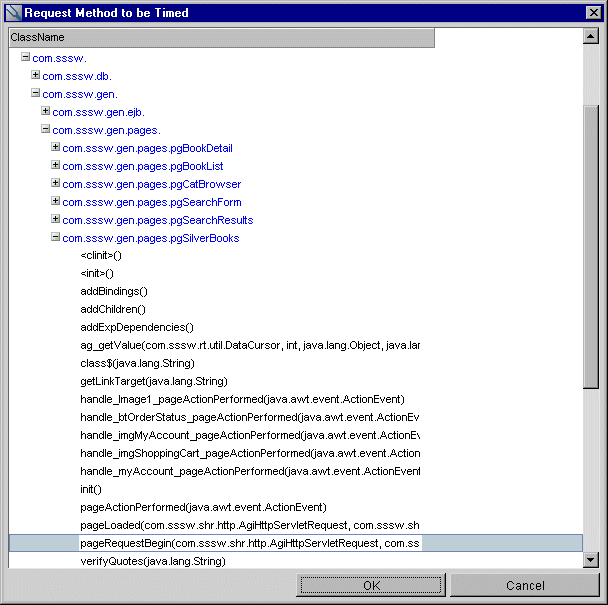
NOTE The Silver Books application resides in the SilverBooks3 database, located in the samples folder of the directory where you installed SilverStream.
In the Silver Books application for example, the pgRequestBegin() event handler is triggered by searching for a book.
The Profiler displays the number of microseconds it takes the method to complete and shows how much of that time is spent in other methods that it calls, as in this example:
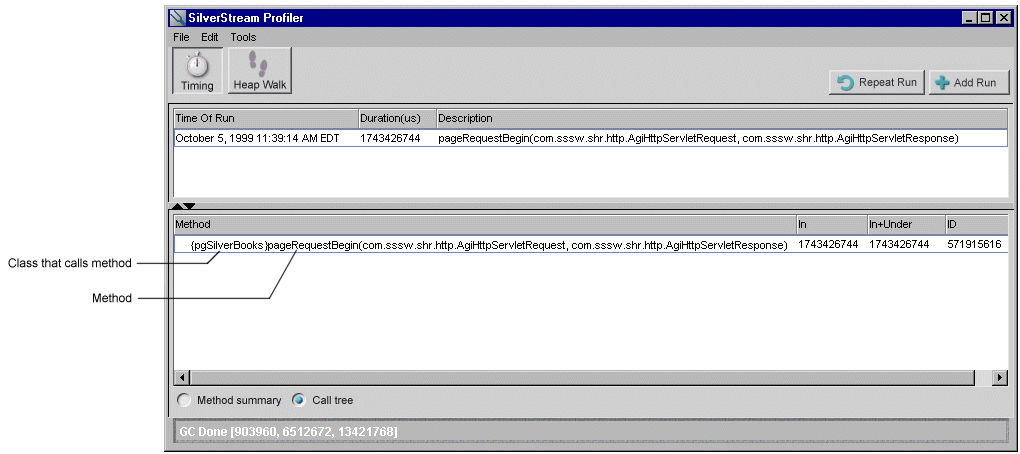
The Call tree view is displayed by default.
Now you are ready to interpret the results of timing runs.

Timing runs measure the duration of methods and can help you isolate areas in your application that consistently take a long time to execute.
For each timing run, compare results in the In column with results in the In + Under column. If they are the same, the method does not call any other methods and uses the total time for its own processing. Otherwise, the In + Under time will be greater than the In result, indicating that nested method calls contribute to the total processing time.
There are two ways to view timing results:
The following sections describe each type of view.
The method summary presents a flat view of all methods that are called from the method you are profiling. In this view, each row displays timing details for an individual method. Data in each row pertains to a unique fully-qualified method call, as in this example:
The following information is presented in the method summary view:
Time spent in the method plus its nested methods, cumulative across all calls | |
To sort the data in any of these columns, click the column header.
The call tree presents a hierarchical view of all methods that are called from the method you are profiling. You can expand any method in the call tree to show timing information for its nested calls. In this view, you can analyze how time is distributed in a calling hierarchy.
The following example shows a partially expanded call tree for the pageRequestBegin() event handler we selected earlier:
In this example, the highlighted call to the getParamterAsObject() method has been expanded to reveal that its 47 microseconds of execution time is divided between its own processing time and four nested methods, as follows:
The following information is presented in the call tree view:

The Profiler Heapdump tool allows you to investigate the causes of the inefficiencies in your process. When you walk the heap, you take a snapshot of all objects in the heap at a particular point in time during the execution of your program.
For each snapshot you take, you can navigate to hierarchical levels of information detail.

By comparing multiple snapshots to baseline data, you can find memory leaks in your program. The Heapdump tool helps you to pinpoint objects that have not been garbage collected since the last snapshot.
Before walking the heap, you must launch the Profiler against a SilverStream application--such as SilverServer or SilverJRunner--and then start your process.
 For more information, see
Launching the Profiler.
 To walk the heap for all objects:

The Profiler window changes to a single pane with two radio buttons near the bottom. The All objects radio button is selected by default. This setting instructs the Profiler to return information about all objects in the heap.

Selecting this button forces garbage collection before taking the heap snapshot. In the Profiler status bar you will see a series of messages, typically providing the following information:
Number of object instances in the heap and how much memory has been allocated | |
When the heap dump completes, the Profiler window displays the following information:
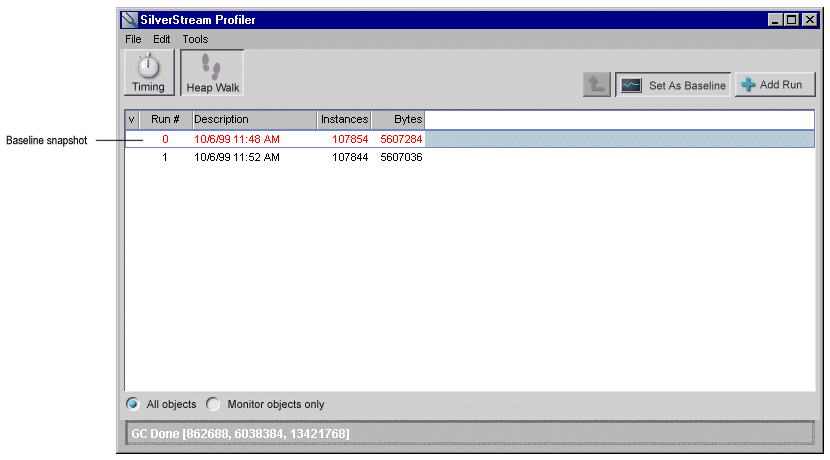
Click once in the row containing the snapshot you want to be your baseline, then click the Set As Baseline button: |
NOTE You should set a baseline. The first run does not need to be the baseline. You can take a series of snapshots and designate any of these as the baseline run. Data from other snapshots is automatically adjusted to be relative to the baseline results. Be aware that each snapshot potentially uses a significant amount of memory. Taking a large number of snapshots can affect system performance.
The Profiler window adds one row for each heap snapshot taken. In this example, there is one baseline snapshot and one additional run:
The selected row expands to show all classes in the heap you selected, as in this example:
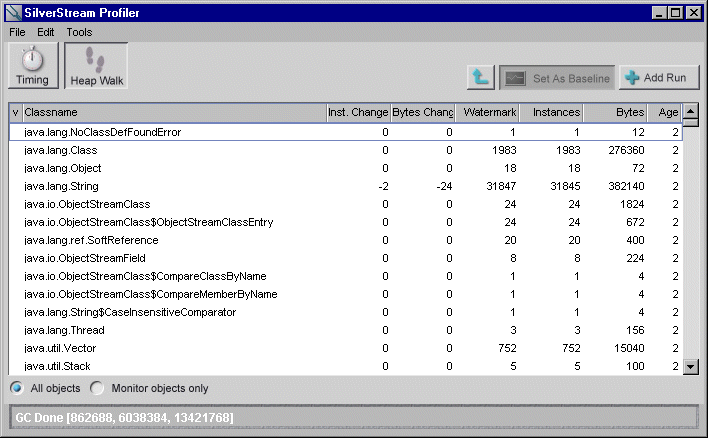
 See
Heap level information to learn what each column means and
Interpreting the results of the heap dump to learn how to interpret the data.
The Profiler displays a tree view of objects in the class you selected, which you can expand to view nested references.
For example, double-clicking on java.io.ObjectStreamClass$CompareClassByName produces this display:
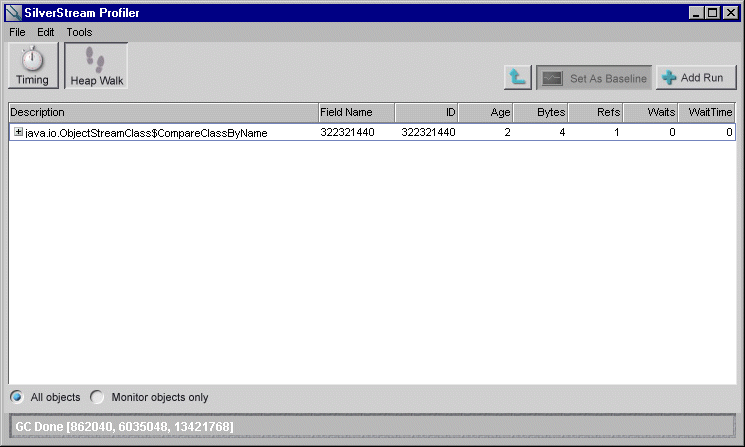
In this example, one instance of java.io.ObjectStreamClass$CompareClassByName class has a referent.
 See
Class level information to learn what each column means and
Interpreting the results of the heap dump to learn how to interpret the data.
![]()
The tree view expands to show the hierarchy of referents for each object, as in this example:
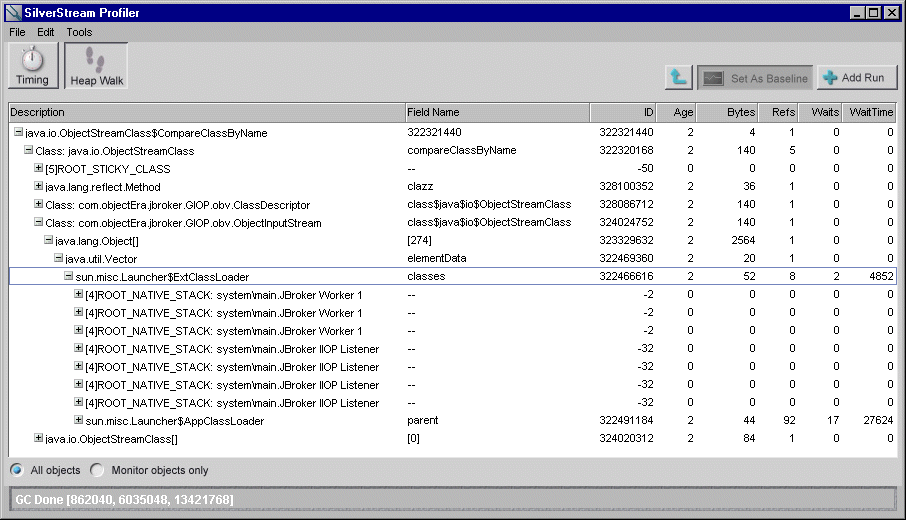
Here, you can see that an instance of java.io.ObjectStreamClass$CompareClassByName has one referent--an instance of java.io.ObjectStreamClass. In turn, this instance of java.io.ObjectStreamClass is referenced by five other objects. As you expand the tree view, you can navigate the hierarchy to find the root reference for any object.
NOTE Objects that appear with zeroes in the Refs column are system objects that are not automatically garbage collected in Java, such as the native stack or the system class (ROOT_STICKY_CLASS), which can contain such resources as file handles, and standard input and output streams.
 See
Object level information to learn what each column means and
Interpreting the results of the heap dump to learn how to interpret the data.

Now you are ready to interpret the results of the heap dump.

It is important to take a baseline snapshot of the heap so the Profiler will have a basis for comparison when evaluating how memory has been allocated and deallocated. For each snapshot you take, you can navigate to hierarchical levels of information detail by walking the heap.
This section covers the following topics:
You can navigate to three levels of information detail when you walk the heap:
This section describes each type of information. To learn how to interpret data at these levels, see Determining how memory is allocated and Finding memory leaks.
Heap level information
When you double-click one of your snapshot runs, you reach the heap level. At this level, the Profiler provides the following information about all classes in the heap:
 See
Walking the heap to learn how to navigate to the heap level of the snapshot.
Class level information
When you double-click one of the classes in the heap, you reach the class level. At this level, the Profiler provides the following information about the class you selected:
Run during which objects in this class were allocated NOTE The Age value indicates how long objects have remained in the heap. This value is not meaningful at the class level. | |
 See
Walking the heap to learn how to navigate to the class level of the snapshot.
Object level information
When you expand the tree view of a class in the heap, you reach the object level. At this level, the Profiler provides the following information about the objects in the class and all of their referents:
Run during which the object was allocated; indicates how long objects have remained in the heap | |
 See
Walking the heap to learn how to navigate to the object level of the snapshot.
The baseline snapshot of the heap provides data against which the Profiler measures activity as processes are executed in the Java Virtual Machine (JVM).
At the heap level, the Instance Change and Bytes Change columns show the difference between the current run and baseline run. In the baseline snapshot, these columns contain zeroes, as in this example:
All other snapshots present data based on a comparison to the baseline.
The Profiler uses color codes at the object level of heap dump snapshots to highlight specific information for you, as follows:
Objects that are referenced only by the finalizer because they are about to be garbage-collected. |
You can determine whether new objects have been allocated by examining the Instance Change and Bytes Change columns in the snapshot. At the heap level, a positive non-zero value in the Instance Change column indicates the number of new objects in a class that have been allocated in the current run. A positive, non-zero value in the Bytes Change column indicates the number of bytes that have been allocated in the current run.
Java provides built-in garbage collection that automatically deallocates objects when they are no longer referenced. However, memory leaks can occur in Java when programs fail to explicitly release references to objects that are no longer used--for example, when Java programs do not clean up static references to objects that have fallen out of scope.
The Heapdump tool helps you isolate this type of memory leak in several ways:

This section explains how to identify objects that are locked in monitor contention by walking the heap for monitor objects.
Before walking the heap for monitor objects, you must launch the Profiler against a SilverStream JVM--such as SilverServer or SilverJRunner--and then start the application.
 For more information, see
Launching the Profiler.
 To walk the heap of monitor objects:
This setting instructs the Profiler to return information only about monitor objects in the heap.

Selecting this button forces garbage collection before taking the monitor heap snapshot. In the Profiler status bar you will see a series of messages, typically providing the following information:
Number of object instances in the heap and how much memory has been allocated | |
When the heap dump completes, the Profiler window displays the following information:
The selected row expands to show a tree view of all monitor object classes in the heap you selected.
 See
Heap level information to learn what each column means and
Interpreting the results of the monitor heap dump to learn how to interpret the data.
![]()
The following example shows the java.lang.Object class, expanded to show a monitor object that is an instance of that class.
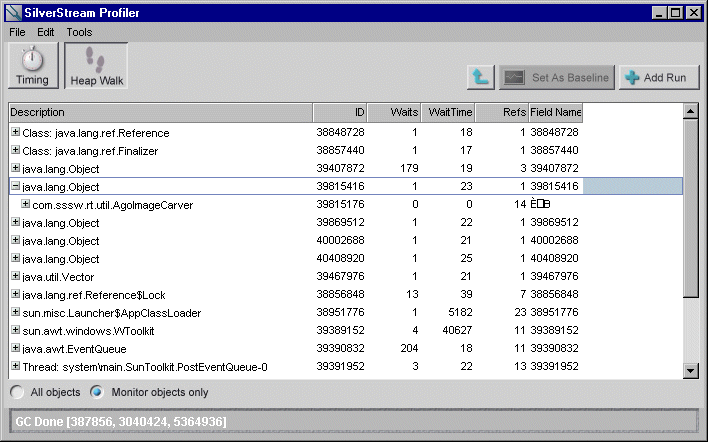
In this example, a thread had to wait once for 23 microseconds to run a critical section of code in com.sssw.rt.util.AgoImageCarver.

Now you are ready to interpret the results of the monitor heap dump.

After taking a snapshot of monitor objects on the heap, you can isolate areas in the application where threads wait a long time for monitors to be released.
When you view monitor object classes in your snapshot, you can sort by the Wait or Wait Time columns to find the most highly contended monitors--that is, the ones associated with the largest number of waits, the longest wait times, or both.
For example, the following snapshot shows monitor objects sorted by number of waits:
As you can see, the monitors in java.awt.EventQueue and java.lang.Object have the largest number of waits associated with them, indicating that there have been frequent attempts to call methods on these objects while they were locked.
The next example shows the same snapshot sorted by wait time:
In this case, the longest average wait times are associated with the monitors in sun.awt.windows.WToolkit and sun.misc.Launcher$AppClassLoader.
