4.3 Reporting and Monitoring Administration Console
Using an administrative browser, enter the following URL and sign in as a Retain administrative user.
Path: http://reporting-and-monitoring-server-IP-or-DNS/RetainStatsServer
NOTE:You can also access the R&M server from the Retain administration interface by clicking either the or links in the left navigation panel.
From the R&M console, you can access the following:
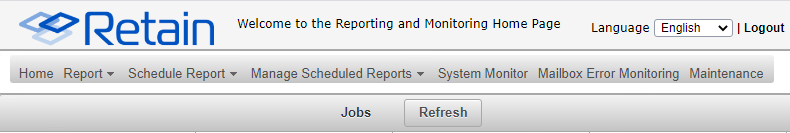
4.3.1 Home Tab
The Reporting and Monitoring Home tab/page lists current archive activity on the associated Retain server. It also includes the following subpanels.
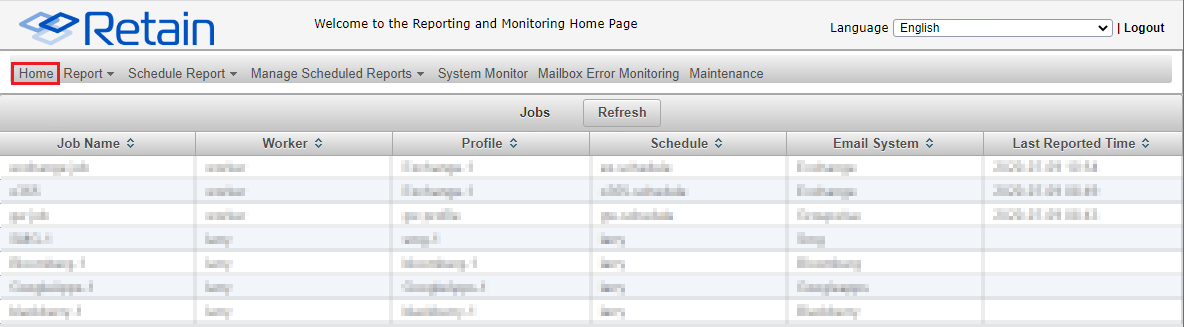
Table 4-2 Using the Reporting and Monitoring Server Home Page
|
Field, Option, or Button |
Information and/or Action |
|
|---|---|---|
|
Language Drop-down |
|
|
|
Top Navigation Bar |
|
|
|
Refresh button |
|
|
|
Jobs list |
This lists all of the jobs in your Retain system along with their associated workers, profiles, schedules, and last-reported run times. You can
|
|
Job History Panel
Path: Retain Reporting and Monitoring Server > select a listed Job
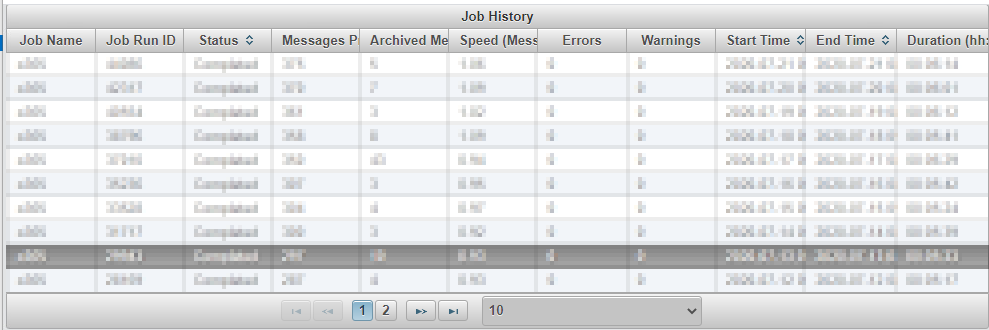
Table 4-3 Using the Job History Panel
|
Field, Option, or Button |
Information and/or Action |
|
|---|---|---|
|
List of Job runs |
|
|
Job Details Panel
Path: Retain Reporting and Monitoring Server > select a listed Job > select a Job Run ID— the Job Details panel for the selected run displays directly below the Job History panel.
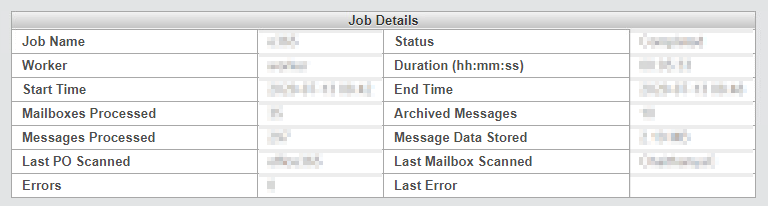
Table 4-4 Using the Job Details Panel
|
Field, Option, or Button |
Information and/or Action |
|
|---|---|---|
|
Job Detail Items |
|
|
Job Mailbox Summary Panel
Path: Retain Reporting and Monitoring Server > select a listed Job > select a Job Run ID— the Job Mailbox Summary panel for the selected run displays directly below the Job Details panel.

Table 4-5 Using the Job Mailbox Summary Panel
|
Field, Option, or Button |
Information and/or Action |
|
|---|---|---|
|
Mailbox Summary Columns |
|
|
4.3.2 Reports, Scheduled Reports, and Manage Scheduled Reports Drop-down Lists
Path: Retain Reporting and Monitoring Server or or

For information and usage instructions for these drop-down reports and tasks, see the following sections:
4.3.3 System Monitor Tab

The System Monitor page shows the following:
-
Report Generation Count: The total number of reports that have been generated on the system, by type.
-
Archiving Progress: Two calculation methods are reflected in these numbers.
-
Messages Archived: These numbers for the previous day, week, and month, include only the primary or initial messages themselves. Attached and child messages that are associated with the primary message threads, are not counted.
-
Total Messages Stored: This number includes all messages. In other words, it reflects all initial messages and all of the attached and child messages associated with them.
-
-
Last Recorded CPU Usage: This is the latest measured System CPU load recorded.
-
Memory Map: This pie chart focuses on memory usage by various Java-associated processes that support Retain functionality.
-
Disk Usage: This reports the disk space consumed by Retain’s data index.
-
Single-Instance Storage Usage: This compares the disk space actually used by archived messages against what would have been used if messages sent to multiple mailboxes had been archived separately for each mailbox.
Retain’s single-instance storage system archives message data only once and links the archived data to the mailboxes that received the messages.
NOTE:If there is a problem gathering system-level information, the CPU, RAM, and system memory usage are set to 0 until the issue is resolved.
4.3.4 Mailbox Error Monitoring Tab
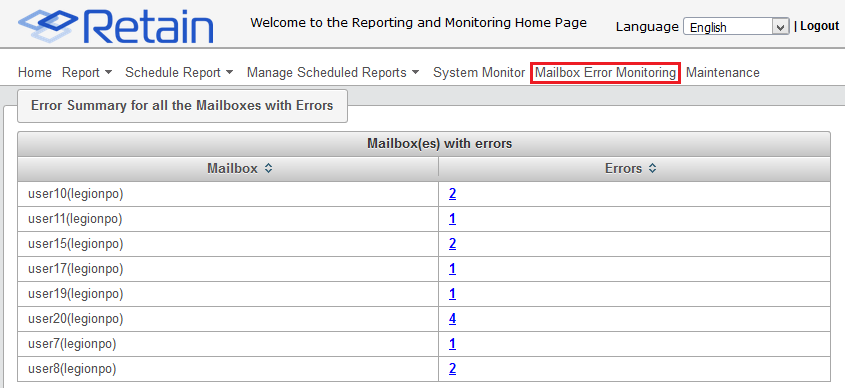
Table 4-6 Using the Mailbox Error Monitoring Page
|
Field, Option, or Button |
Information and/or Action |
|
|---|---|---|
|
Mailbox(es) with errors |
||
|
Mailbox name |
|
|
A number that links to error information for the mailbox.
|
|
NOTE:This page is also accessible through the Retain Admin Console> Overview >
4.3.5 Maintenance Tab
The R&M server refreshes itself automatically each morning at 2 a.m. by expiring and deleting statistical data that is older than 14 days.
Use this dialog if you need to manually purge older data.
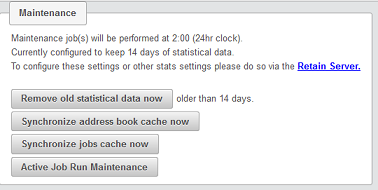
-
Retain Server link: Click this to open the Retain administrative console.
In the administrative console, you can adjust the data retention period setting by accessing the Reporting and Monitoring configuration page. Micro Focus recommends not retaining statistical data longer than 30 days.
-
Remove old statistical data now: Use this button to remove statistical data that is older than the number of days indicated, immediately rather than at 2 a.m.
-
Synchronize address book cache now: Use this button if you need to ensure that the R&M server’s address book is synchronized with the Retain server’s address book. (They are automatically synchronized every 24 hours, but they can get out of sync in the interim.)
-
Synchronize jobs cache now: Use this button if you need to ensure that the R&M server’s job cache is synchronized with the Retain server’s address book. (They are automatically synchronized every 24 hours, but they can get out of sync in the interim.)
-
Active job run maintenance: Use this button to clear the current job status, for example when a job has completed but the R&M server shows it as is still running.