Collector Development Topics
TROUBLESHOOTING AND DEBUGGING
Whether you are writing your own Collector, extending an existing Collector, or simply trying to understand how an existing Collector works and how it is parsing your events, it will be quite helpful to learn some simple debugging and troubleshooting techniques. This section will introduce you to those techniques.
Collector Troubleshooting
Before we begin, let's make sure we understand some basics about Collectors and Connectors:
- In basic operation, event records are gathered by the Connector (either in active fetch mode; or in the case of Syslog, SNMP, and Novell Audit, in Event Source Server receive mode) and queued until the Collector is ready to use them.
- The Collector fetches one record at a time from the Connector, parses it, and then fetches the next record. The Collector can combine, skip, or duplicate records if it sees fit.
- Connectors can work in several "modes" which are controlled by runtime parameters; the Collector can set a particular Connection Mode and pass that to the Connector on startup, but this can also be customized in ESM. You should be careful changing this, however, as Collectors are usually written to expect a given mode.
- Connectors that work with indexable data (files, databases) will generate an offset as it reads through the data to indicate where it has read to. This offset is passed to the Collector as record meta-data; the Collector is responsible for replying to the Connector to acknowledge when it has finished processing up to a given offset (in general, this is handled automatically by the template, but see SQLQuery). If this is done, the Connector will be able to track to the offset even across restarts (if set, see below).
- Event sources can be configured to pick up from the last read offset, or to always start at the beginning of the data, in which case the last read offset is thrown away when the Event Source node is restarted.
- The Connector cache is persisted even across restarts of the associated ESM node. As a result, restarting the Collector/Connector/Event Source will not always clear out the cache and restart fetching of data from the beginning. In some cases you may need to restart the entire Collector Manager to clear the cache.
And also some other miscellaneous notes:
- Most Collectors have an Execution Mode parameter which supports a
debugoption. This is not the same as debugging the Collector code using the ESM debugger; this execution mode produces an output file that holds every event sent to Sentinel to help troubleshoot whether events are leaving the Collector correctly or being filtered downstream. - When a Collector is running, the Collector code is executing on the Collector Manager that is hosting that Collector. When you are debugging a Collector in ESM however, the Collector code is executing on the machine running ESM. In general this does not matter as the Connector feed is re-routed appropriately, but there are rare conditions where non-standard code will make this do things you might not expect, for example if the Collector directly connects to localhost.
Before Troubleshooting
Before you attempt to troubleshoot a Collector, you should go through some initial validation:
- Make sure you have the latest version of both the Collector and associated Connector(s), and that you have properly installed the updated components in ESM. The Plug-ins Website has the latest components, and the process for installing new components into ESM is detailed in the documentation.
- Restart the Collector and associated components; the Collector Manager; and even Sentinel if required to rule out transient problems with memory etc. Check the log files for potential error conditions (search for SEVERE events).
- Review the Collector documentation and the Connector documentation completely (both available on the Plug-ins Website) to make sure that the Collector and Connector parameters are set appropriately for your environment.
Isolating Collector Operations
Any Collector operates in a larger data collection context: the event source (represented by the Event Source ESM node) generates event records, they are sent to/retrieved by the Connector, parsed by the Collector, sent to the Collector Manager where the Mapping Service and Global Filters are applied, and then finally the data (hopefully) is stored in Sentinel. There can be filters at the event source, ESM nodes, global filters, and viewing filters. At times, it can be difficult to determine where exactly data collection or parsing is breaking down.
To help with this situation, there are a number of tools supported by the Collector framework that can help isolate exactly what the Collector is doing. First, you will want to validate that your data is actually making it to the Connector:
- Make sure your event source is configured and sending events.
- Make sure that your event source is represented by an ESM Event Source node, and that it is properly hooked up to the correct Connector and Collector.
- Right-click on the Event Source and select Raw data tap. The resulting dialog, after a few seconds, should start showing event records coming from your event source (if necessary, perform some actions that should generate event records).
If the raw data tap does not show any event records, then you may have a problem with the way the event source is configured, or the corresponding configuration of the Event Source node, the Event Source Server node, or the Connector node in ESM. Review the Connector documentation to make sure that everything is set up correctly.
If you do get event records, you can select them in the upper part of the Raw data tap dialog and look at the details below. Each record is made up of a set of attributes with assigned values - some attributes come from the record data itself, some represent metadata about how the event was collected and processed. You should be able to select several of the records in the raw data tap and examine the contents, and correlate the information you are seeing there with the activity performed on the event source.
The raw data tap however is a transient thing, and can easily be flooded with too many events if you are looking for something specific. Another method can be used to capture a set of input records to a logfile, called a Connector Dump, that can be examined and re-used at your leisure:
- Ensure that the event source and ESM is properly configured, as before.
- Right-click on the Connector through which the data will be passing, and select Edit.
- Select the General Settings tab, then select the checkbox titled Save raw data to file.
- Browse for and type in a filename on disk somewhere to store the data. Note that the target location must be writable by the Collector Manager service user.
- Restart the ESM components, and generate some event records from the event source.
The resulting file is called a Connector Dump, and each line in the file represents an event record that was received and processed by the Connector. What you see in that file is exactly what the Collector received from the Connector. The data is encoded into JSON notation, which is Javascript's native notation and is fairly easy to read. You should be able to correlate the attribute-value pairs in the JSON notation with the same data that appeared in the raw data tap.
In a moment, we'll describe how to subsequently replay the data captured in a Connector Dump back into the Collector, for the purpose of testing specific event parsing logic. But for the moment, let's assume that you see the data that you expected to see coming in from the Connector (e.g. in the Connector Dump file), but that you aren't seeing the output you expected. We can also isolate the output from the Collector, to help eliminate downstream filters as a possible problem:
- In ESM, right-click on the Collector that is processing your data, and select Edit.
- On the Parameters tab, locate the Execution Mode parameter, and set it to
debug. - Perform the same tests as before, generating data to be sent through the Collector and parsed.
- The
debugExecution Mode will cause the Collector to produce a JSON-formatted output file for each Event that it sends.- This file's location depends on how the Collector is subsequently executed: if run normally, it will be in the standard Collector Manager log location, for
example
/var/opt/novell/sentinel/log; if run via the JavaScript debugger, it will be in the user's home directory on the system doing the debugging, for example/home/user/.novell/sentinel/log - The file is named with the Collector's UUID, a timestamp, and a .json extension.
- To determine a Collector's UUID, right-click on its node in ESM and select Edit, then look under the Configure Collector tab.
- This file's location depends on how the Collector is subsequently executed: if run normally, it will be in the standard Collector Manager log location, for
example
With the combination of Connector Dump files and Execution Mode debug output, you should be able to look carefully at the input data and correlate it with the output data to see exactly what the Collector did to parse the data, without any possible interference from upstream or downstream components.
Replaying Data Through A Collector With a Connector Dump
Collectors have a built-in ability to replay data that was previously captured as a Connector Dump file, to recreate the exact environment in which the data was originally generated. For all intents and purposes, this methodology completely fakes the Collector into believing that it is receiving the original data; it does so by replacing the new input record generated when the Connector Dump file is read with the unpacked original JSON record that was written as a line in the Connector Dump file.
Note that this procedure comes with some important caveats:
- The original event time of the event record will be restored, hence you must disable Trust event source time or the data will not show up in real time. Instead it will be stored as if it was processed at the original time of capture, which may be what you want but will prevent real-time display or correlation.
- Original event sources that support offsets, like files and databases, will not respond to manual manipulation of the offset because the Connector Dump file is simply replaying the original order of records.
- Correspondingly, since the Collector never knows that the data is replay data, the normal file offsets on the Connector Dump file itself will not work correctly. The result of this is that although reading the file will work fine, stopping and restarting the Event Source node in ESM will cause the replay to restart at the beginning of the Connector Dump file. If you want to only replay a later section, edit the Connector Dump file.
- Events produced when in Replay mode will have the SensorType (
st) field set toT, so they can be distinguished from normal events. Otherwise the output should be identical to normal parsing.
With that, let's cover how to set up and replay Connector Dump data:
- In ESM, right-click the Collector that you wish to test and select Add Connector.
- Add a File Connector to the Collector.
- Next, right-click on the new File Connector and select Add Event Source.
- Set up a file Event Source and point it to read from the Connector Dump file. In general, you won't use a rotating file and the offset setting won't be honored.
- While editing the new Event Source, select the Connection Mode (Advanced) tab and ensure that the
File:Connector Dumpmode is selected. In general, this will be the default option unless the Collector supports a native file format. - Start the Event Source (with or without the Collector in debug mode) and the original data will be replayed.
As stated before, the Collector will have no idea that it is not seeing data from the original event source. As a result, you should be able to examine the parsing logic for a specific event over and over again to see how it works, and if you are editing the code this is a good way to test specific parsing logic. You can of course edit the Connector Dump file to hold only specific events of interest and replay just those events.
Debugging a Collector
The general process for debugging Collectors within ESM is detailed in the Sentinel documentation, so the first step to follow is to review that documentation. In general, you will be using the debugger in Live Mode with a Connector Dump file as input as above (and we'll only be covering JavaScript here).
Collectors contain thousands of lines of code, so this section will provide a couple of tips on how to accelerate your debug process. Note that for GA Collectors, the API-level JS code is minimized (e.g. all whitespace is removed) so it will be quite difficult to step into API methods and interpret what is happening. The API methods are thoroughly tested, however, and if you want to debug them directly you can create a Test build using the SDK.
OK, let's start:
- Right-click on the Collector of interest and select Debug. This will pop up the Live Mode/Standalone dialog.
- Leave Live Mode selected, and hit OK.
- While the debugger is coming up, switch back to ESM, right-click on the Event Source node of interest (likely a Connector Dump file), and select Start. If you don't start your Event Source and/or no data arrives, the Collector will appear to lock up as it waits for data to arrive.
- Back in the Debugger, hit Play once to load the code. Note that in general, you don't have to close the Debugger if you make changes to the code (e.g. upload a new Collector), you just have to hit Stop and then Play again. Your breakpoints should even be maintained, as long as the line numbers did not change. There is some evidence that this works better on Linux vs. Windows clients, however.
- Scroll all the way to the bottom of the code, then observe the last 46 lines of the file. Put a breakpoint on the line that says
if (!instance.initialize())... - Hit Play again; the Collector execution pointer should advance to your breakpoint and you are ready to debug.
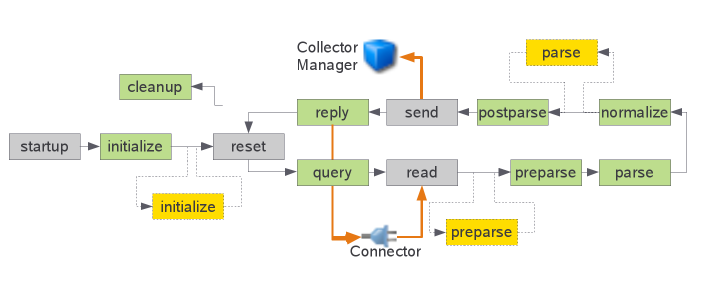
Again, review the last 46 lines of the file, starting from the if (!instance.initialize()) line. That code implements the main
Collector template loop, and you should be able to match up method calls in those lines with states in the flow diagram. The release Collector-specific code will be in
the initialize(), preParse(), parse(), normalize(), and postParse() methods, so step into those to examine
the code for this Collector. If local customizations have been added, those will be present in customPreparse() and customParse().
- The line
rec = conn.read();is where the input record is fetched. Immediately after that line is executed, the global objectrecshould contain the input record. - If you see the
rec.CONNECTION_ERRORattribute set to anything, that means that there was some problem getting a record from the Connector. If it equalsNODATA, for example, then the read attempt timed out as no data was received. - When you are looking at this main loop in the debugger and stepping over it, you are in global scope. In this scope the global variables are visible under the This tab at bottom left and can be expanded and examined.
- If you Step Into a method like
rec.parse(), therecobject becomes the scope. This means that the sub-attributes of therecobject are now the top level that you can see under the This tab, asrecis nowthis. - Any local variables created when in object scope will show up under the Locals tab, but will disappear when you step out of object scope.
- You can use the Evaluate tab at lower right to manipulate the data the Collector is working with - you can do pretty much anything you want and execute "live" JS code as needed. Using this is a good way to test code before you copy it into your Collector.
This should get you started with debugging, if you have any questions, a great place to ask them is the Plug-in SDK Forum.
- Back to Develop to Sentinel
Collector Development Guide
- Overview
- Getting Started
- Initial Build
- Plug-in Contents
- Data Parsing
- Build Process
- Event Construction
- Taxonomy
- Connector Interaction
- Common Code
- Parameters
- Additional Information